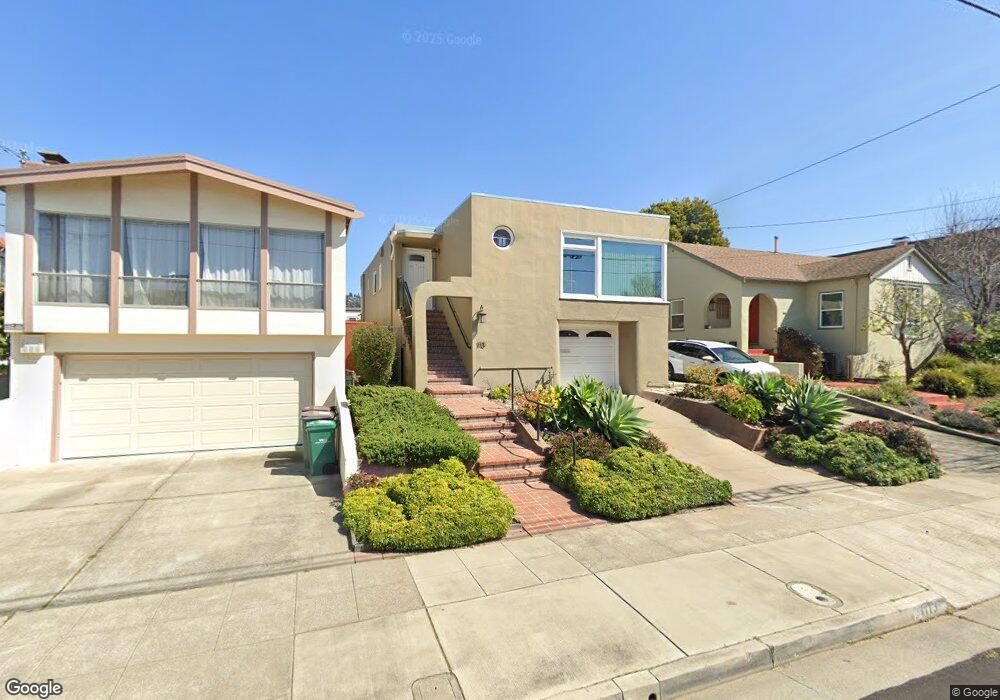
1113 Key Route Blvd Albany, CA 94706
Albany Terrace NeighborhoodEstimated Value: $1,442,000 - $1,927,012
4
Beds
2
Baths
2,235
Sq Ft
$783/Sq Ft
Est. Value
About This Home
This home is located at 1113 Key Route Blvd, Albany, CA 94706 and is currently estimated at $1,750,253, approximately $783 per square foot. 1113 Key Route Blvd is a home located in Alameda County with nearby schools including Albany Middle School, Albany High School, and The Crowden School.
Ownership History
Date
Name
Owned For
Owner Type
Purchase Details
Closed on
May 12, 2015
Sold by
Yamashiro Jason Alexis Lustig and Yamashiro Amy Miyoshi
Bought by
Romy Roy Sujoy and Romy Chalraborty
Current Estimated Value
Home Financials for this Owner
Home Financials are based on the most recent Mortgage that was taken out on this home.
Original Mortgage
$625,500
Interest Rate
3.63%
Mortgage Type
New Conventional
Purchase Details
Closed on
May 21, 2014
Sold by
Allen Joyce A
Bought by
Yamashiro Jason Alexis Lustig and Yamashiro Amy Miyoshi
Home Financials for this Owner
Home Financials are based on the most recent Mortgage that was taken out on this home.
Original Mortgage
$475,000
Interest Rate
4.23%
Mortgage Type
New Conventional
Purchase Details
Closed on
Sep 23, 2013
Sold by
Allen Joyce A and Luopa Joyce Allen
Bought by
Allen Joyce A
Purchase Details
Closed on
May 17, 2007
Sold by
Allen Luopa Joyce and Schary Family Trust
Bought by
Allen Luopa Joyce
Create a Home Valuation Report for This Property
The Home Valuation Report is an in-depth analysis detailing your home's value as well as a comparison with similar homes in the area
Home Values in the Area
Average Home Value in this Area
Purchase History
| Date | Buyer | Sale Price | Title Company |
|---|---|---|---|
| Romy Roy Sujoy | $915,000 | Old Republic Title Company | |
| Yamashiro Jason Alexis Lustig | $875,000 | Old Republic Title Company | |
| Allen Joyce A | -- | Old Republic Title Company | |
| Allen Luopa Joyce | -- | None Available |
Source: Public Records
Mortgage History
| Date | Status | Borrower | Loan Amount |
|---|---|---|---|
| Previous Owner | Romy Roy Sujoy | $625,500 | |
| Previous Owner | Yamashiro Jason Alexis Lustig | $475,000 |
Source: Public Records
Tax History Compared to Growth
Tax History
| Year | Tax Paid | Tax Assessment Tax Assessment Total Assessment is a certain percentage of the fair market value that is determined by local assessors to be the total taxable value of land and additions on the property. | Land | Improvement |
|---|---|---|---|---|
| 2025 | $18,405 | $1,099,655 | $390,588 | $709,067 |
| 2024 | $18,405 | $1,078,098 | $382,931 | $695,167 |
| 2023 | $17,414 | $1,056,961 | $375,423 | $681,538 |
| 2022 | $16,791 | $1,036,237 | $368,062 | $668,175 |
| 2021 | $16,578 | $1,015,924 | $360,847 | $655,077 |
| 2020 | $16,452 | $1,005,511 | $357,149 | $648,362 |
| 2019 | $16,094 | $985,802 | $350,148 | $635,654 |
| 2018 | $15,638 | $966,477 | $343,284 | $623,193 |
| 2017 | $15,255 | $947,527 | $336,553 | $610,974 |
| 2016 | $14,524 | $928,953 | $329,956 | $598,997 |
| 2015 | $13,134 | $892,481 | $267,744 | $624,737 |
| 2014 | -- | $64,002 | $25,201 | $38,801 |
Source: Public Records
Map
Nearby Homes
- 1111 Key Route Blvd
- 1115 Key Route Blvd
- 1109 Key Route Blvd
- 1119 Key Route Blvd
- 1105 Key Route Blvd
- 1110 Pomona Ave
- 1121 Key Route Blvd
- 1118 Santa fe Ave
- 1106 Pomona Ave
- 1116 Santa fe Ave
- 1114 Pomona Ave
- 1112 Key Route Blvd
- 1116 Key Route Blvd
- 1103 Key Route Blvd
- 1104 Pomona Ave
- 1123 Key Route Blvd
- 1108 Key Route Blvd
- 1120 Key Route Blvd
- 1102 Pomona Ave
- 1304 Dartmouth St