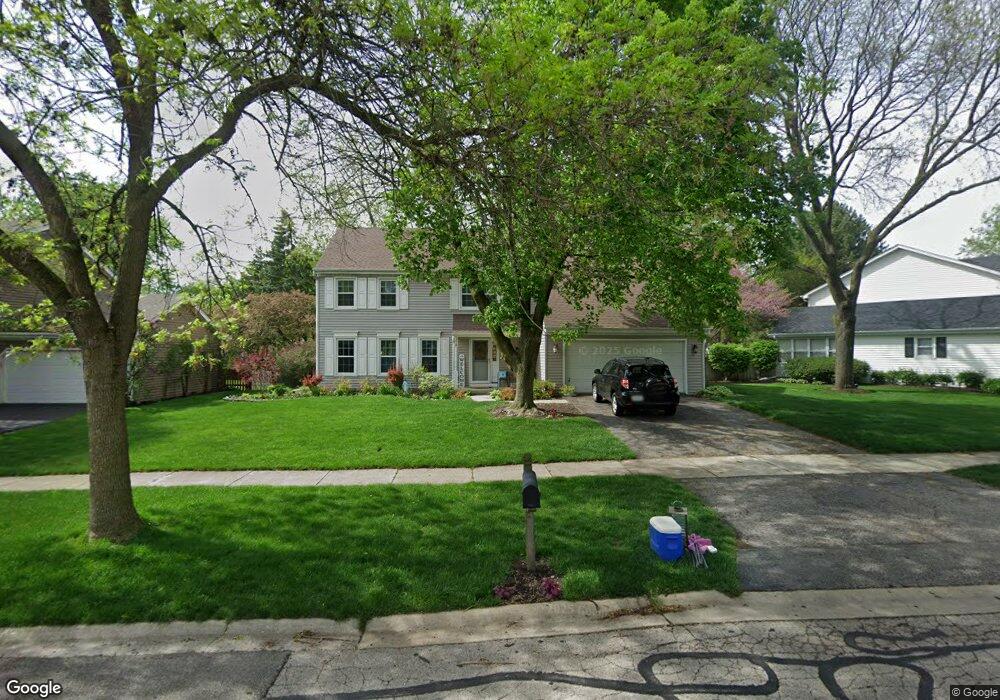
1113 Piccadilly Cir Naperville, IL 60563
Brookdale NeighborhoodEstimated Value: $559,000 - $644,000
4
Beds
3
Baths
2,195
Sq Ft
$273/Sq Ft
Est. Value
About This Home
This home is located at 1113 Piccadilly Cir, Naperville, IL 60563 and is currently estimated at $599,984, approximately $273 per square foot. 1113 Piccadilly Cir is a home located in DuPage County with nearby schools including Brookdale Elementary School, Thayer J. Hill Middle School, and Metea Valley High School.
Ownership History
Date
Name
Owned For
Owner Type
Purchase Details
Closed on
Aug 5, 2015
Sold by
Gorczak Dorothy
Bought by
Mantovani Paul G and Mantovani Deborah A
Current Estimated Value
Home Financials for this Owner
Home Financials are based on the most recent Mortgage that was taken out on this home.
Original Mortgage
$235,000
Outstanding Balance
$184,638
Interest Rate
4%
Mortgage Type
New Conventional
Estimated Equity
$415,346
Purchase Details
Closed on
Sep 23, 1994
Sold by
Powers Richard B and Powers Julie A
Bought by
Gorczak Stanley and Gorczak Dorothy
Home Financials for this Owner
Home Financials are based on the most recent Mortgage that was taken out on this home.
Original Mortgage
$132,600
Interest Rate
8.62%
Create a Home Valuation Report for This Property
The Home Valuation Report is an in-depth analysis detailing your home's value as well as a comparison with similar homes in the area
Home Values in the Area
Average Home Value in this Area
Purchase History
| Date | Buyer | Sale Price | Title Company |
|---|---|---|---|
| Mantovani Paul G | $360,000 | First American Title Company | |
| Gorczak Stanley | $206,500 | -- |
Source: Public Records
Mortgage History
| Date | Status | Borrower | Loan Amount |
|---|---|---|---|
| Open | Mantovani Paul G | $235,000 | |
| Previous Owner | Gorczak Stanley | $132,600 |
Source: Public Records
Tax History Compared to Growth
Tax History
| Year | Tax Paid | Tax Assessment Tax Assessment Total Assessment is a certain percentage of the fair market value that is determined by local assessors to be the total taxable value of land and additions on the property. | Land | Improvement |
|---|---|---|---|---|
| 2024 | $10,101 | $169,828 | $49,624 | $120,204 |
| 2023 | $9,668 | $152,600 | $44,590 | $108,010 |
| 2022 | $9,306 | $142,170 | $41,210 | $100,960 |
| 2021 | $9,012 | $137,100 | $39,740 | $97,360 |
| 2020 | $8,999 | $137,100 | $39,740 | $97,360 |
| 2019 | $8,643 | $130,400 | $37,800 | $92,600 |
| 2018 | $8,640 | $128,050 | $36,830 | $91,220 |
| 2017 | $8,400 | $123,710 | $35,580 | $88,130 |
| 2016 | $8,246 | $118,730 | $34,150 | $84,580 |
| 2015 | $8,167 | $112,730 | $32,420 | $80,310 |
| 2014 | $8,005 | $106,990 | $30,530 | $76,460 |
| 2013 | $7,988 | $107,730 | $30,740 | $76,990 |
Source: Public Records
Map
Nearby Homes
- 1106 Langley Cir
- 1887 Paddington Ave Unit 3
- 873 Quin Ct Unit 202
- 2911 Dearborn Ct
- 2805 Bond Cir
- 920 Charlton Ln Unit 5106
- 1748 Windward Ave Unit 92
- 1022 Neudearborn Ln Unit 19-1022
- 2084 Maplewood Cir
- 2011 Maplewood Cir
- 30W214 Briar Ln
- 30W162 Claymore Ln
- 5S022 Raymond Dr
- 5S040 Pebblewood Ln Unit E103
- 5S353 Stewart Dr
- 2138 Iron Ridge Ln
- 2024 Iron Ridge Ln
- 2040 Iron Ridge Ln
- 2044 Iron Ridge Ln
- 2026 Iron Ridge Ln
- 1107 Piccadilly Cir
- 1119 Piccadilly Cir
- 1704 Prince Ct
- 1767 Brookdale Rd
- 1771 Brookdale Rd
- 1700 Prince Ct
- 1112 Piccadilly Cir
- 1106 Piccadilly Cir
- 1779 Brookdale Rd
- 1708 Prince Ct
- 1100 Piccadilly Cir
- 1787 Brookdale Rd
- 1120 Piccadilly Cir
- 1124 Piccadilly Cir
- 1105 Queens Ct
- 1747 Brookdale Rd
- 1128 Piccadilly Cir
- 1791 Brookdale Rd
- 1709 Prince Ct
- 1764 Brookdale Rd