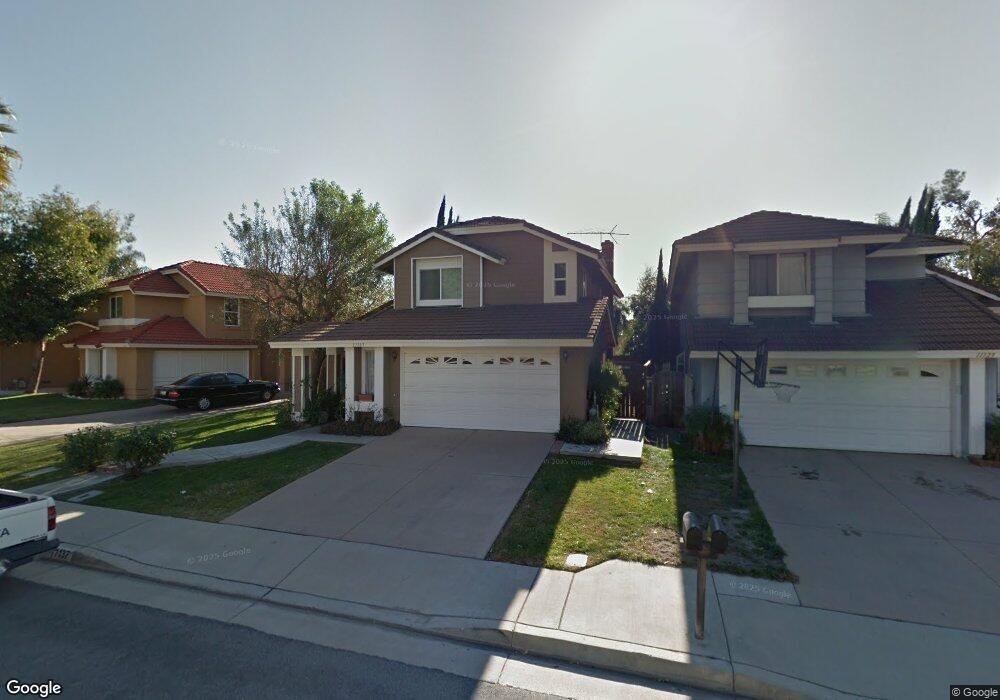
11137 Shaw St Rancho Cucamonga, CA 91701
Victoria NeighborhoodEstimated Value: $764,000 - $787,000
3
Beds
3
Baths
1,485
Sq Ft
$522/Sq Ft
Est. Value
About This Home
This home is located at 11137 Shaw St, Rancho Cucamonga, CA 91701 and is currently estimated at $775,323, approximately $522 per square foot. 11137 Shaw St is a home located in San Bernardino County with nearby schools including Victoria Groves Elementary, Vineyard Junior High, and Los Osos High.
Ownership History
Date
Name
Owned For
Owner Type
Purchase Details
Closed on
May 11, 2009
Sold by
Livingston Michelle N and Livingston Teresa L
Bought by
Livingston Michelle N and Livingston Teresa L
Current Estimated Value
Home Financials for this Owner
Home Financials are based on the most recent Mortgage that was taken out on this home.
Original Mortgage
$235,800
Interest Rate
4.78%
Mortgage Type
New Conventional
Purchase Details
Closed on
Jun 14, 2001
Sold by
Mackay Kenneth and Mackay Laura
Bought by
Livingston Michelle N and Livingston Teresa L
Home Financials for this Owner
Home Financials are based on the most recent Mortgage that was taken out on this home.
Original Mortgage
$156,000
Interest Rate
7.21%
Purchase Details
Closed on
Apr 21, 1994
Sold by
Eddings Gregory and Eddings Carole
Bought by
Mackay Kenneth and Mackay Laura
Home Financials for this Owner
Home Financials are based on the most recent Mortgage that was taken out on this home.
Original Mortgage
$143,640
Interest Rate
8.83%
Mortgage Type
FHA
Create a Home Valuation Report for This Property
The Home Valuation Report is an in-depth analysis detailing your home's value as well as a comparison with similar homes in the area
Home Values in the Area
Average Home Value in this Area
Purchase History
| Date | Buyer | Sale Price | Title Company |
|---|---|---|---|
| Livingston Michelle N | -- | Fidelity National Title Co | |
| Livingston Michelle N | -- | Fidelity National Title Co | |
| Livingston Michelle N | $195,000 | Stewart Title | |
| Mackay Kenneth | $146,000 | Chicago Title Co |
Source: Public Records
Mortgage History
| Date | Status | Borrower | Loan Amount |
|---|---|---|---|
| Closed | Livingston Michelle N | $235,800 | |
| Closed | Livingston Michelle N | $156,000 | |
| Previous Owner | Mackay Kenneth | $143,640 |
Source: Public Records
Tax History Compared to Growth
Tax History
| Year | Tax Paid | Tax Assessment Tax Assessment Total Assessment is a certain percentage of the fair market value that is determined by local assessors to be the total taxable value of land and additions on the property. | Land | Improvement |
|---|---|---|---|---|
| 2025 | $4,306 | $324,496 | $72,018 | $252,478 |
| 2024 | $4,306 | $318,133 | $70,606 | $247,527 |
| 2023 | $4,188 | $311,896 | $69,222 | $242,674 |
| 2022 | $4,144 | $305,781 | $67,865 | $237,916 |
| 2021 | $4,127 | $299,785 | $66,534 | $233,251 |
| 2020 | $3,986 | $296,711 | $65,852 | $230,859 |
| 2019 | $4,024 | $290,893 | $64,561 | $226,332 |
| 2018 | $3,949 | $285,189 | $63,295 | $221,894 |
| 2017 | $3,786 | $279,597 | $62,054 | $217,543 |
| 2016 | $3,689 | $274,114 | $60,837 | $213,277 |
| 2015 | $3,659 | $269,996 | $59,923 | $210,073 |
| 2014 | $3,579 | $264,707 | $58,749 | $205,958 |
Source: Public Records
Map
Nearby Homes
- 6792 Galveston Place
- 10980 Santa Barbara Place
- 11344 Sunrise Ct
- 11376 Starlight Dr
- 6886 Cabrini Ct
- 6572 San Benito Ave
- 11253 Drake St
- 11266 Gannon St
- 11017 Piedmont St
- 6979 Walker Ct
- 6915 Stanislaus Place
- 11530 Marcello Way
- 6516 Alameda Ave
- 6393 Kettle Peak Place
- 11571 Pinnacle Peak Ct
- 10672 Finch Ave
- 11537 Mount Hood Ct
- 6701 Marsala Place
- 6999 Canosa Place
- 6842 Palm Dr
- 11129 Shaw St
- 11123 Shaw St
- 11149 Shaw St
- 11142 Donnelly St
- 11148 Donnelly St
- 11117 Shaw St
- 11154 Donnelly St
- 11130 Donnelly St
- 11126 Shaw St
- 11120 Shaw St
- 11132 Shaw St
- 11114 Shaw St
- 11111 Shaw St
- 11124 Donnelly St
- 11108 Shaw St
- 11138 Shaw St
- 11102 Shaw St
- 11118 Donnelly St
- 11105 Shaw St
- 11144 Shaw St