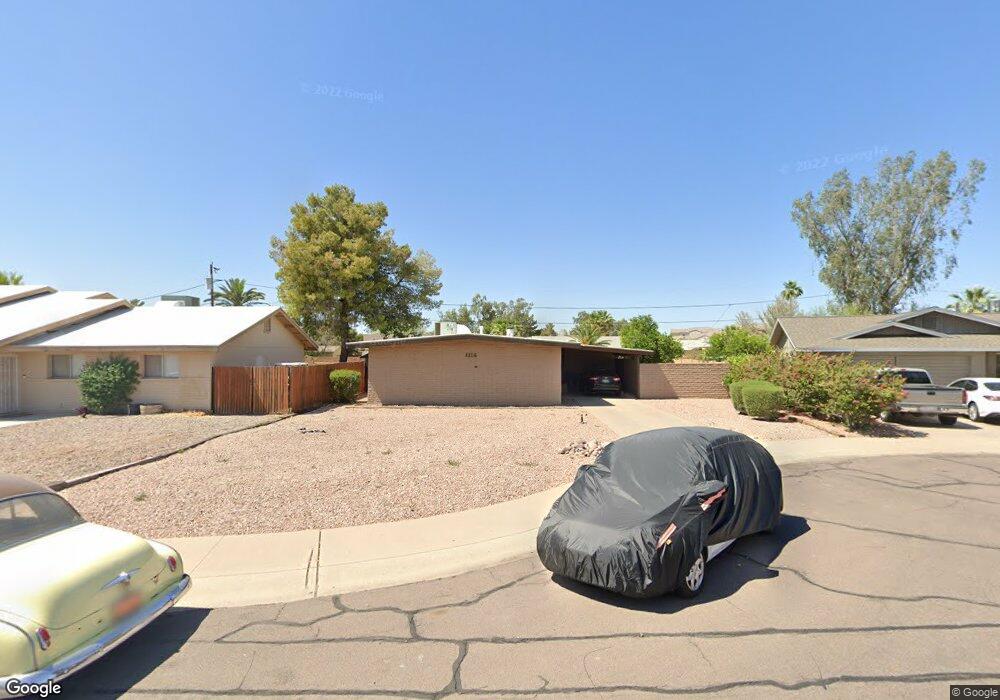
1114 E Redondo Cir Tempe, AZ 85282
Alameda NeighborhoodEstimated Value: $359,000 - $447,000
Studio
2
Baths
1,260
Sq Ft
$320/Sq Ft
Est. Value
About This Home
This home is located at 1114 E Redondo Cir, Tempe, AZ 85282 and is currently estimated at $403,651, approximately $320 per square foot. 1114 E Redondo Cir is a home located in Maricopa County with nearby schools including Joseph P. Spracale Elementary, Connolly Middle School, and McClintock High School.
Ownership History
Date
Name
Owned For
Owner Type
Purchase Details
Closed on
Mar 19, 2014
Sold by
Dela Torre Jose Luis and De La Torre Blanca E
Bought by
Jose Luis De La Torre and De La T Blanca E
Current Estimated Value
Purchase Details
Closed on
Aug 26, 2003
Sold by
Barrett James Daniel and Barrett Robert H
Bought by
Torre Jose De La and Torre Blanca De La
Home Financials for this Owner
Home Financials are based on the most recent Mortgage that was taken out on this home.
Original Mortgage
$84,000
Outstanding Balance
$38,485
Interest Rate
6.06%
Mortgage Type
New Conventional
Estimated Equity
$365,166
Purchase Details
Closed on
May 17, 2001
Sold by
Barrett James Daniel
Bought by
Barrett James Daniel and Barrett Robert H
Create a Home Valuation Report for This Property
The Home Valuation Report is an in-depth analysis detailing your home's value as well as a comparison with similar homes in the area
Home Values in the Area
Average Home Value in this Area
Purchase History
| Date | Buyer | Sale Price | Title Company |
|---|---|---|---|
| Jose Luis De La Torre | -- | None Available | |
| Torre Jose De La | $124,000 | Security Title Agency | |
| Barrett James Daniel | -- | -- |
Source: Public Records
Mortgage History
| Date | Status | Borrower | Loan Amount |
|---|---|---|---|
| Open | Torre Jose De La | $84,000 |
Source: Public Records
Tax History
| Year | Tax Paid | Tax Assessment Tax Assessment Total Assessment is a certain percentage of the fair market value that is determined by local assessors to be the total taxable value of land and additions on the property. | Land | Improvement |
|---|---|---|---|---|
| 2025 | $1,924 | $16,048 | -- | -- |
| 2024 | $1,776 | $15,284 | -- | -- |
| 2023 | $1,776 | $33,000 | $6,600 | $26,400 |
| 2022 | $1,704 | $24,900 | $4,980 | $19,920 |
| 2021 | $1,715 | $23,810 | $4,760 | $19,050 |
| 2020 | $1,663 | $21,200 | $4,240 | $16,960 |
| 2019 | $1,632 | $19,210 | $3,840 | $15,370 |
| 2018 | $1,591 | $17,360 | $3,470 | $13,890 |
| 2017 | $1,544 | $16,460 | $3,290 | $13,170 |
| 2016 | $1,533 | $15,670 | $3,130 | $12,540 |
| 2015 | $1,472 | $15,070 | $3,010 | $12,060 |
Source: Public Records
Map
Nearby Homes
- 2090 S Dorsey Ln Unit 1025
- 1125 E Broadway Rd Unit 102
- 1233 E Broadmor Dr
- 1059 E Broadmor Dr
- 1445 E Broadway Rd Unit 106
- 1445 E Broadway Rd Unit 120
- 1445 E Broadway Rd Unit 116
- 2052 S Rural Rd Unit C
- 720 E Broadway Ln
- 2710 S Terrace Rd
- 2515 S Palm Dr
- 1611 E El Parque Dr
- 2035 S Elm St Unit 226
- 2035 S Elm St Unit 138
- 2035 S Elm St Unit 109
- 1418 S Newberry Ln
- 1022 E Wesleyan Dr
- 921 E Campus Dr
- 611 E Encanto Dr
- 1229 E Spence Ave
- 1108 E Redondo Cir
- 1120 E Redondo Cir
- 1123 E Palmcroft Dr
- 1124 E Redondo Cir
- 1127 E Palmcroft Dr Unit 3
- 1119 E Palmcroft Dr
- 1135 E Palmcroft Dr
- 1109 E Redondo Cir
- 1115 E Redondo Cir
- 1121 E Redondo Cir
- 1145 E Palmcroft Dr
- 1103 E Redondo Cir
- 2131 S Terrace Rd
- 2112 S Stanley Place
- 2120 S Stanley Place
- 1151 E Palmcroft Dr
- 1115 E Palmcroft Dr
- 2127 S Terrace Rd
- 2126 S Stanley Place Unit 51
- 1116 E Broadmor Dr
Your Personal Tour Guide
Ask me questions while you tour the home.