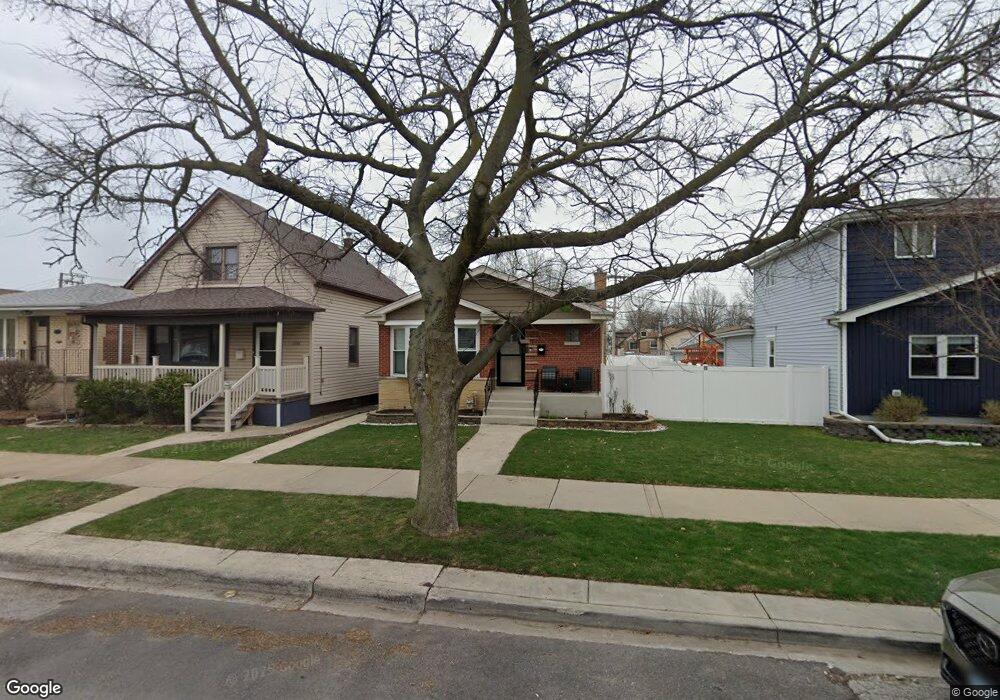
11143 S St Louis Ave Chicago, IL 60655
Mount Greenwood NeighborhoodEstimated Value: $320,290 - $357,000
3
Beds
2
Baths
1,060
Sq Ft
$322/Sq Ft
Est. Value
About This Home
This home is located at 11143 S St Louis Ave, Chicago, IL 60655 and is currently estimated at $340,823, approximately $321 per square foot. 11143 S St Louis Ave is a home located in Cook County with nearby schools including George F Cassell Elementary School, Morgan Park High School, and St. Christina School.
Ownership History
Date
Name
Owned For
Owner Type
Purchase Details
Closed on
Feb 1, 2019
Sold by
Taylor Kevin R and Taylor Melanie A
Bought by
Taylor Kevin R and Taylor Melanie A
Current Estimated Value
Purchase Details
Closed on
Apr 17, 2017
Sold by
Kelly Brendan S and Kelly Joey M
Bought by
Taylor Kevin R
Home Financials for this Owner
Home Financials are based on the most recent Mortgage that was taken out on this home.
Original Mortgage
$247,350
Outstanding Balance
$205,437
Interest Rate
4.14%
Mortgage Type
New Conventional
Estimated Equity
$135,386
Purchase Details
Closed on
Nov 10, 2004
Sold by
Kelly James M and Kelly Kathleen
Bought by
Kelly Brendan J and Kelly Joey M
Home Financials for this Owner
Home Financials are based on the most recent Mortgage that was taken out on this home.
Original Mortgage
$190,000
Interest Rate
5.71%
Mortgage Type
Unknown
Create a Home Valuation Report for This Property
The Home Valuation Report is an in-depth analysis detailing your home's value as well as a comparison with similar homes in the area
Home Values in the Area
Average Home Value in this Area
Purchase History
| Date | Buyer | Sale Price | Title Company |
|---|---|---|---|
| Taylor Kevin R | -- | None Available | |
| Taylor Kevin R | $255,000 | Citywide Title Corporation | |
| Kelly Brendan J | $200,000 | Ticor Title |
Source: Public Records
Mortgage History
| Date | Status | Borrower | Loan Amount |
|---|---|---|---|
| Open | Taylor Kevin R | $247,350 | |
| Previous Owner | Kelly Brendan J | $190,000 |
Source: Public Records
Tax History Compared to Growth
Tax History
| Year | Tax Paid | Tax Assessment Tax Assessment Total Assessment is a certain percentage of the fair market value that is determined by local assessors to be the total taxable value of land and additions on the property. | Land | Improvement |
|---|---|---|---|---|
| 2024 | $3,572 | $26,644 | $6,080 | $20,564 |
| 2023 | $3,462 | $20,202 | $4,864 | $15,338 |
| 2022 | $3,462 | $20,202 | $4,864 | $15,338 |
| 2021 | $3,765 | $22,000 | $4,864 | $17,136 |
| 2020 | $4,040 | $21,193 | $4,620 | $16,573 |
| 2019 | $4,692 | $23,290 | $4,620 | $18,670 |
| 2018 | $4,612 | $23,290 | $4,620 | $18,670 |
| 2017 | $3,767 | $20,838 | $4,134 | $16,704 |
| 2016 | $3,682 | $20,838 | $4,134 | $16,704 |
| 2015 | $3,346 | $20,838 | $4,134 | $16,704 |
| 2014 | $2,885 | $18,077 | $3,891 | $14,186 |
| 2013 | $2,816 | $18,077 | $3,891 | $14,186 |
Source: Public Records
Map
Nearby Homes
- 11160 S Christiana Ave
- 10950 S Homan Ave
- 11325 S Homan Ave
- 11157 S Spaulding Ave
- 11024 S Spaulding Ave
- 3350 W 114th St
- 3435 W 115th St
- 10951 S Kedzie Ave
- 3712 W 115th St
- 3836 W 110th Place
- 3249 W 108th St
- 3812 W 109th Place
- 11237 S Albany Ave
- 3125 W 114th St
- 11130 S Whipple St
- 3835 W 109th Place
- 3041 W 113th Place
- 3723 W 115th Place
- 11214 S Sacramento Ave
- 3171 W 115th St Unit 1N
- 11143 S Saint Louis Ave
- 11147 S Saint Louis Ave
- 11137 S Saint Louis Ave
- 11153 S Saint Louis Ave
- 11133 S Saint Louis Ave
- 11131 S Saint Louis Ave
- 11155 S Saint Louis Ave
- 11142 S Trumbull Ave
- 11140 S Trumbull Ave
- 11146 S Trumbull Ave
- 11136 S Trumbull Ave
- 11129 S Saint Louis Ave
- 11150 S Trumbull Ave
- 11161 S Saint Louis Ave
- 11134 S Trumbull Ave
- 11136 S Saint Louis Ave
- 11136 S Saint Louis Ave
- 11154 S Trumbull Ave
- 11130 S Trumbull Ave