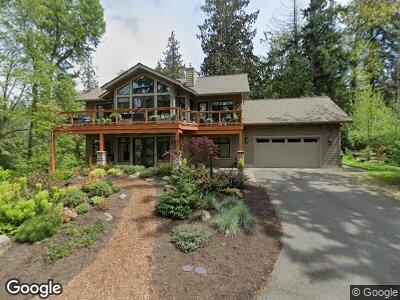
1115 39th St Bellingham, WA 98229
Samish NeighborhoodEstimated Value: $968,000 - $1,221,000
2
Beds
2
Baths
2,518
Sq Ft
$446/Sq Ft
Est. Value
About This Home
This home is located at 1115 39th St, Bellingham, WA 98229 and is currently estimated at $1,123,064, approximately $446 per square foot. 1115 39th St is a home with nearby schools including Happy Valley Elementary School, Fairhaven Middle School, and Sehome High School.
Ownership History
Date
Name
Owned For
Owner Type
Purchase Details
Closed on
Feb 15, 2018
Sold by
Greenwood Judd M and Greenwood Rebecca J
Bought by
Greenwood Judd M and Greenwood Rebecca J
Current Estimated Value
Purchase Details
Closed on
Oct 30, 2002
Sold by
Fry Guy and Fry Constance G
Bought by
Greenwood Judd M and Pillitteri Rebecca
Purchase Details
Closed on
Jul 17, 2002
Sold by
Glenovich James Anthony and Glenovich Lynne M
Bought by
Fry Guy and Fry Constance G
Home Financials for this Owner
Home Financials are based on the most recent Mortgage that was taken out on this home.
Original Mortgage
$50,000
Interest Rate
6.52%
Purchase Details
Closed on
Jul 9, 2002
Sold by
Leenstra Bernetta K and Williams Beverly A
Bought by
Glenovich James A and Glenovich Lynne M
Home Financials for this Owner
Home Financials are based on the most recent Mortgage that was taken out on this home.
Original Mortgage
$50,000
Interest Rate
6.52%
Create a Home Valuation Report for This Property
The Home Valuation Report is an in-depth analysis detailing your home's value as well as a comparison with similar homes in the area
Home Values in the Area
Average Home Value in this Area
Purchase History
| Date | Buyer | Sale Price | Title Company |
|---|---|---|---|
| Greenwood Judd M | -- | None Available | |
| Greenwood Judd M | $80,000 | Chicago Title Insurance | |
| Fry Guy | $64,500 | Whatcom Land Title | |
| Glenovich James A | -- | Whatcom Land Title |
Source: Public Records
Mortgage History
| Date | Status | Borrower | Loan Amount |
|---|---|---|---|
| Open | Greenwood Judd M | $40,000 | |
| Open | Greenwood Judd M | $387,000 | |
| Closed | Greenwood Judd M | $400,000 | |
| Previous Owner | Fry Guy | $50,000 |
Source: Public Records
Tax History Compared to Growth
Tax History
| Year | Tax Paid | Tax Assessment Tax Assessment Total Assessment is a certain percentage of the fair market value that is determined by local assessors to be the total taxable value of land and additions on the property. | Land | Improvement |
|---|---|---|---|---|
| 2024 | $8,721 | $1,079,946 | $422,350 | $657,596 |
| 2023 | $8,721 | $1,118,556 | $437,450 | $681,106 |
| 2022 | $7,150 | $951,968 | $372,300 | $579,668 |
| 2021 | $6,647 | $767,737 | $300,250 | $467,487 |
| 2020 | $6,528 | $673,448 | $263,375 | $410,073 |
| 2019 | $5,079 | $639,248 | $250,000 | $389,248 |
| 2018 | $5,272 | $498,235 | $133,998 | $364,237 |
| 2017 | $4,649 | $442,254 | $118,940 | $323,314 |
| 2016 | $1,093 | $407,337 | $109,440 | $297,897 |
| 2015 | $1,110 | $98,420 | $98,420 | $0 |
| 2014 | -- | $98,420 | $98,420 | $0 |
| 2013 | -- | $95,000 | $95,000 | $0 |
Source: Public Records
Map
Nearby Homes
- 0 37th St Unit NWM2285563
- 900 40th St
- 1501 Samish Way
- 0 Wildwood Dr Unit NWM2316576
- 1800 40th Place
- 4214 Samish Crest Dr
- 514 Fielding Ct
- 820 32nd St
- 2014 39th St
- 3123 Cowgill Ave
- 700 32nd St Unit A412
- 700 32nd St Unit A109
- 700 32nd St Unit A407
- 700 32nd St Unit A305
- 700 32nd St Unit A209
- 700 32nd St Unit A301
- 680 32nd St Unit C206
- 680 32nd St Unit C204
- 680 32nd St Unit C306
- 680 32nd St Unit C212