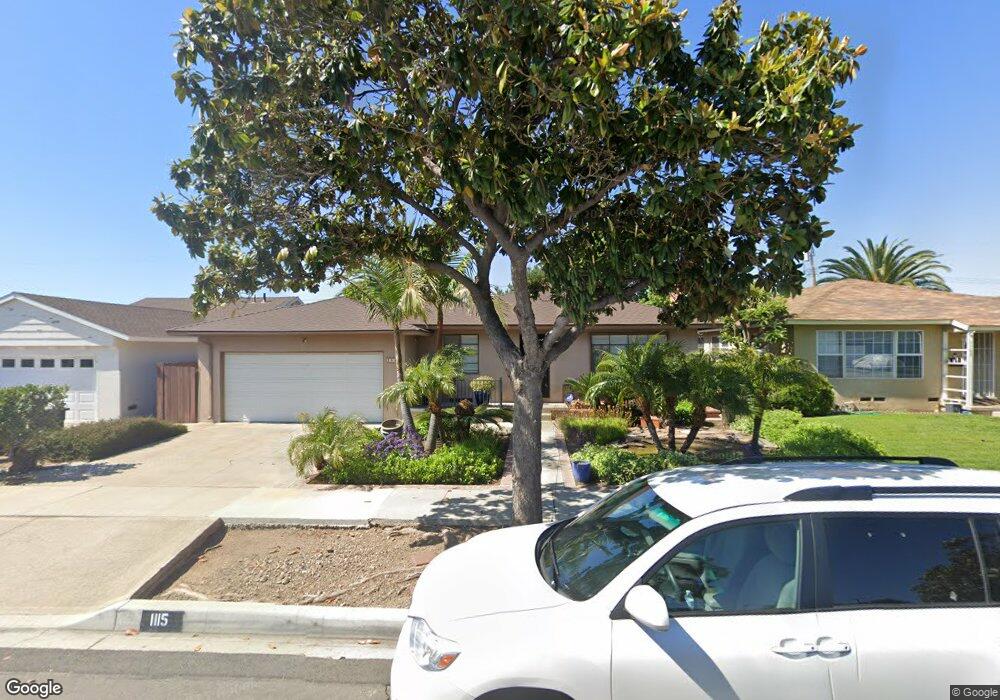
1115 E Oakmont Ave Orange, CA 92867
Estimated Value: $1,048,385 - $1,180,000
3
Beds
2
Baths
1,801
Sq Ft
$614/Sq Ft
Est. Value
About This Home
This home is located at 1115 E Oakmont Ave, Orange, CA 92867 and is currently estimated at $1,105,096, approximately $613 per square foot. 1115 E Oakmont Ave is a home located in Orange County with nearby schools including Cambridge Elementary School, Yorba Middle School, and Orange High School.
Ownership History
Date
Name
Owned For
Owner Type
Purchase Details
Closed on
Nov 3, 2022
Sold by
Oakmont Ave Properties Inc
Bought by
Moors Trust
Current Estimated Value
Purchase Details
Closed on
Apr 24, 2012
Sold by
Moors Susen J
Bought by
Oakmont Ave Properties Inc
Purchase Details
Closed on
Nov 24, 2009
Sold by
Moors Susen J
Bought by
Moors Susen J and Moors Trust
Create a Home Valuation Report for This Property
The Home Valuation Report is an in-depth analysis detailing your home's value as well as a comparison with similar homes in the area
Home Values in the Area
Average Home Value in this Area
Purchase History
| Date | Buyer | Sale Price | Title Company |
|---|---|---|---|
| Moors Trust | -- | -- | |
| Oakmont Ave Properties Inc | -- | None Available | |
| Moors Susen J | -- | None Available | |
| Moors Susen J | -- | None Available |
Source: Public Records
Tax History
| Year | Tax Paid | Tax Assessment Tax Assessment Total Assessment is a certain percentage of the fair market value that is determined by local assessors to be the total taxable value of land and additions on the property. | Land | Improvement |
|---|---|---|---|---|
| 2025 | $1,216 | $79,494 | $26,626 | $52,868 |
| 2024 | $1,216 | $77,936 | $26,104 | $51,832 |
| 2023 | $1,185 | $76,408 | $25,592 | $50,816 |
| 2022 | $1,159 | $74,910 | $25,090 | $49,820 |
| 2021 | $1,131 | $73,442 | $24,598 | $48,844 |
| 2020 | $1,120 | $72,689 | $24,345 | $48,344 |
| 2019 | $1,110 | $71,264 | $23,867 | $47,397 |
| 2018 | $1,094 | $69,867 | $23,399 | $46,468 |
| 2017 | $1,058 | $68,498 | $22,941 | $45,557 |
| 2016 | $1,040 | $67,155 | $22,491 | $44,664 |
| 2015 | $1,024 | $66,147 | $22,153 | $43,994 |
| 2014 | $1,002 | $64,852 | $21,719 | $43,133 |
Source: Public Records
Map
Nearby Homes
- 1241 E Mayfair Ave
- 1344 E Mayfair Ave
- 934 E Rose Ave
- 622 E Lomita Ave
- 552 N Cambridge St
- 918 N Cleveland St
- 504 E Barkley Ave
- 994 N Cleveland St
- 425 E Everett Place
- 1127 E Adams Ave
- 631 E Elizabeth Dr
- 1801 E Collins Ave Unit 36
- 1801 E Collins Ave Unit 42
- 365 N Magnolia St
- 860 N Grand St
- 355 N Pine St
- 534 E Hoover Ave
- 255 N Waverly St
- 1514 E Palm Ave
- 2201 E Oakmont Ave
- 1125 E Oakmont Ave
- 1103 E Oakmont Ave
- 1116 E Lomita Ave
- 1135 E Oakmont Ave
- 1106 E Lomita Ave
- 1134 E Lomita Ave
- 1114 E Oakmont Ave
- 1143 E Oakmont Ave
- 1045 E Oakmont Ave
- 1124 E Oakmont Ave
- 1104 E Oakmont Ave
- 1132 E Oakmont Ave
- 1144 E Lomita Ave
- 800 N Maplewood St
- 1201 E Oakmont Ave
- 1035 E Oakmont Ave
- 804 N Maplewood St
- 1142 E Oakmont Ave
- 1202 E Lomita Ave
- 808 N Maplewood St
Your Personal Tour Guide
Ask me questions while you tour the home.