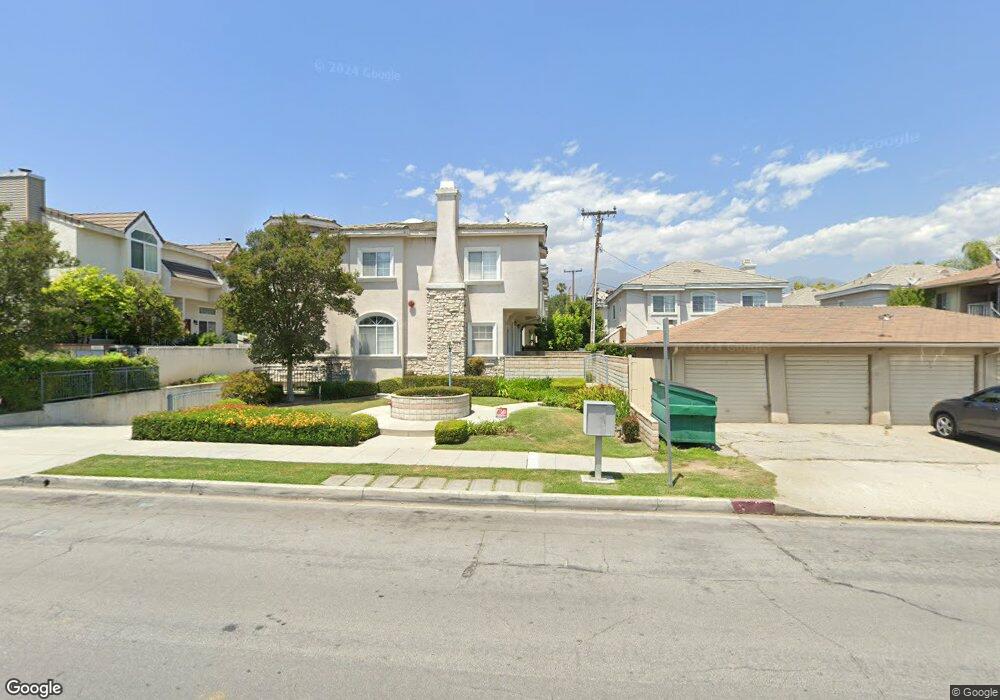
1115 Fairview Ave Unit D Arcadia, CA 91007
Estimated Value: $1,019,000 - $1,227,000
3
Beds
3
Baths
2,103
Sq Ft
$531/Sq Ft
Est. Value
About This Home
This home is located at 1115 Fairview Ave Unit D, Arcadia, CA 91007 and is currently estimated at $1,116,642, approximately $530 per square foot. 1115 Fairview Ave Unit D is a home located in Los Angeles County with nearby schools including Hugo Reid Elementary School, Foothills Middle School, and Arcadia High School.
Ownership History
Date
Name
Owned For
Owner Type
Purchase Details
Closed on
Sep 22, 2009
Sold by
Hwang James M and James Ming Hwang 2006 Living T
Bought by
Chen Sung Cheng
Current Estimated Value
Home Financials for this Owner
Home Financials are based on the most recent Mortgage that was taken out on this home.
Original Mortgage
$323,000
Outstanding Balance
$210,704
Interest Rate
5.14%
Mortgage Type
New Conventional
Estimated Equity
$905,938
Purchase Details
Closed on
Jan 13, 2006
Sold by
Hwang James M
Bought by
Hwang James M and The James Ming Hwang 2006 Living Trust
Purchase Details
Closed on
Jul 26, 2002
Sold by
Cooper Investors Inc
Bought by
Hwang James
Home Financials for this Owner
Home Financials are based on the most recent Mortgage that was taken out on this home.
Original Mortgage
$297,600
Interest Rate
6.43%
Purchase Details
Closed on
Nov 27, 2000
Sold by
Uptown Development Llc
Bought by
Cooper Investors Inc
Create a Home Valuation Report for This Property
The Home Valuation Report is an in-depth analysis detailing your home's value as well as a comparison with similar homes in the area
Home Values in the Area
Average Home Value in this Area
Purchase History
| Date | Buyer | Sale Price | Title Company |
|---|---|---|---|
| Chen Sung Cheng | $613,000 | Lawyers Title Company | |
| Hwang James M | -- | None Available | |
| Hwang James | $372,000 | American Title Co | |
| Cooper Investors Inc | $319,500 | Chicago Title |
Source: Public Records
Mortgage History
| Date | Status | Borrower | Loan Amount |
|---|---|---|---|
| Open | Chen Sung Cheng | $323,000 | |
| Previous Owner | Hwang James | $297,600 |
Source: Public Records
Tax History
| Year | Tax Paid | Tax Assessment Tax Assessment Total Assessment is a certain percentage of the fair market value that is determined by local assessors to be the total taxable value of land and additions on the property. | Land | Improvement |
|---|---|---|---|---|
| 2025 | $9,054 | $791,255 | $472,174 | $319,081 |
| 2024 | $9,054 | $775,741 | $462,916 | $312,825 |
| 2023 | $8,866 | $760,532 | $453,840 | $306,692 |
| 2022 | $8,577 | $745,621 | $444,942 | $300,679 |
| 2021 | $8,416 | $731,002 | $436,218 | $294,784 |
| 2019 | $8,174 | $709,323 | $423,281 | $286,042 |
| 2018 | $7,981 | $695,416 | $414,982 | $280,434 |
| 2016 | $7,767 | $668,415 | $398,869 | $269,546 |
| 2015 | $7,633 | $658,376 | $392,878 | $265,498 |
| 2014 | $7,528 | $645,481 | $385,183 | $260,298 |
Source: Public Records
Map
Nearby Homes
- 1126 Fairview Ave Unit 210
- 1126 Fairview Ave Unit 106
- 905 Sunset Blvd Unit A
- 1150 Okoboji Dr
- 1124 W Huntington Dr Unit 2
- 1088 Sunset Blvd Unit A
- 9160 Huntington Dr
- 1027 Arcadia Ave Unit C
- 1140 Arcadia Ave
- 9144 E Fairview Ave
- 946 Fairview Ave Unit 8
- 1006 Arcadia Ave Unit D
- 914 Fairview Ave Unit 13
- 801 S Michillinda Ave
- 1228 Temple City Blvd
- 9163 Duarte Rd
- 1222 Temple City Blvd
- 905 W Duarte Rd Unit A
- 731 S Michillinda Ave
- 879 Michigan Blvd Unit O
- 1117 Fairview Ave Unit D
- 1117 Fairview Ave Unit B
- 1117 Fairview Ave Unit A
- 1117 Fairview Ave Unit C
- 1115 Fairview Ave Unit C
- 1115 Fairview Ave Unit B
- 1115 Fairview Ave Unit A
- 1125 Fairview Ave Unit H
- 1125 Fairview Ave Unit G
- 1125 Fairview Ave Unit F
- 1125 Fairview Ave Unit E
- 1125 Fairview Ave Unit D
- 1125 Fairview Ave Unit C
- 1125 Fairview Ave Unit B
- 1125 Fairview Ave Unit A
- 1121 Fairview Ave Unit I
- 1121 Fairview Ave Unit H
- 1121 Fairview Ave Unit G
- 1121 Fairview Ave Unit F
- 1121 Fairview Ave Unit E
Your Personal Tour Guide
Ask me questions while you tour the home.