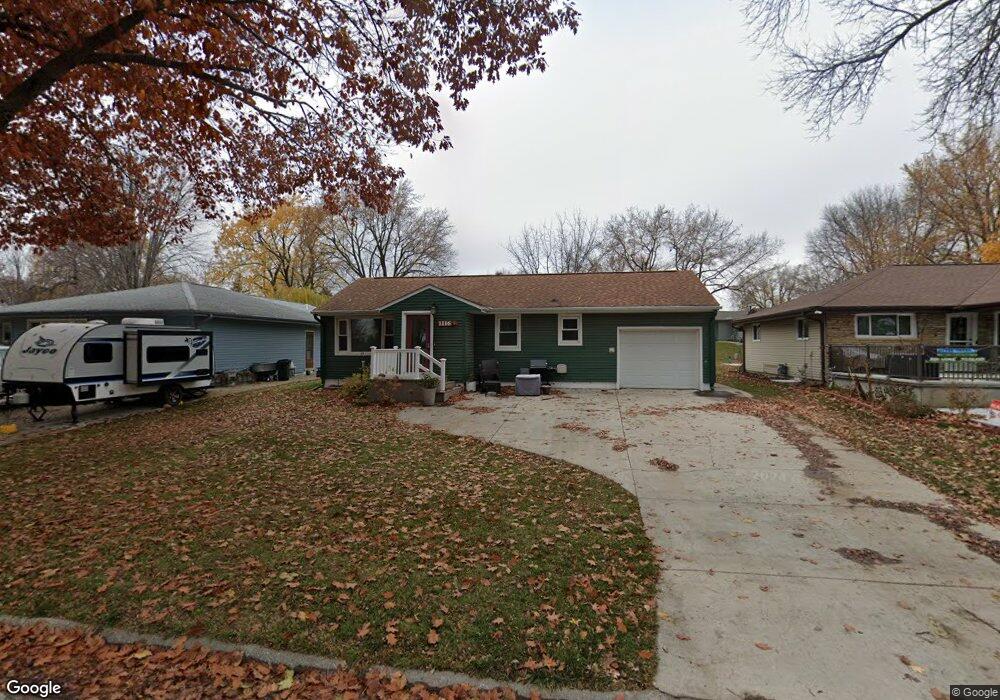
1116 3rd St Lake View, IA 51450
Estimated Value: $124,000 - $174,000
--
Bed
1
Bath
904
Sq Ft
$162/Sq Ft
Est. Value
About This Home
This home is located at 1116 3rd St, Lake View, IA 51450 and is currently estimated at $146,759, approximately $162 per square foot. 1116 3rd St is a home located in Sac County with nearby schools including East Sac County High School.
Ownership History
Date
Name
Owned For
Owner Type
Purchase Details
Closed on
Jun 21, 2018
Sold by
Julie L Ruggles
Bought by
Brotherton Hannah
Current Estimated Value
Home Financials for this Owner
Home Financials are based on the most recent Mortgage that was taken out on this home.
Original Mortgage
$72,000
Outstanding Balance
$62,366
Interest Rate
4.57%
Estimated Equity
$84,393
Purchase Details
Closed on
Jul 9, 2015
Sold by
Ruggles Julie L and Ruggles Richard A
Bought by
Ruggles Julie A and Julie L Ruggles Revocable Trust
Create a Home Valuation Report for This Property
The Home Valuation Report is an in-depth analysis detailing your home's value as well as a comparison with similar homes in the area
Home Values in the Area
Average Home Value in this Area
Purchase History
| Date | Buyer | Sale Price | Title Company |
|---|---|---|---|
| Brotherton Hannah | -- | -- | |
| Ruggles Julie A | -- | None Available |
Source: Public Records
Mortgage History
| Date | Status | Borrower | Loan Amount |
|---|---|---|---|
| Open | Brotherton Hannah | $72,000 | |
| Closed | Brotherton Hannah | -- |
Source: Public Records
Tax History Compared to Growth
Tax History
| Year | Tax Paid | Tax Assessment Tax Assessment Total Assessment is a certain percentage of the fair market value that is determined by local assessors to be the total taxable value of land and additions on the property. | Land | Improvement |
|---|---|---|---|---|
| 2025 | $1,764 | $152,400 | $4,750 | $147,650 |
| 2024 | $1,764 | $129,980 | $4,450 | $125,530 |
| 2023 | $1,418 | $129,980 | $4,450 | $125,530 |
| 2022 | $1,374 | $95,880 | $4,450 | $91,430 |
| 2021 | $1,374 | $95,880 | $4,450 | $91,430 |
| 2020 | $990 | $76,260 | $4,450 | $71,810 |
| 2019 | $820 | $76,260 | $4,450 | $71,810 |
| 2018 | $948 | $63,400 | $0 | $0 |
| 2017 | $948 | $58,200 | $0 | $0 |
| 2016 | $882 | $58,200 | $0 | $0 |
| 2015 | $882 | $56,530 | $0 | $0 |
| 2014 | $860 | $56,530 | $0 | $0 |
Source: Public Records
Map
Nearby Homes
- 1122 3rd St
- 1110 3rd St
- 1128 3rd St
- 970 6th St
- 1021 Zein Circle Dr
- 1017 Zein Circle Dr
- 964 6th St
- 1011 Zein Circle Dr
- 1134 3rd St
- 1025 Zein Circle Dr
- 1003 Zein Circle Dr Unit 694
- 1034 3rd St
- 961 6th St
- 1004 Zein Circle Dr
- 1022 Zein Circle Dr
- 953 6th St
- 969 7th St
- 1024 3rd St
- 1012 Zein Circle Dr
- 1018 Zein Circle Dr