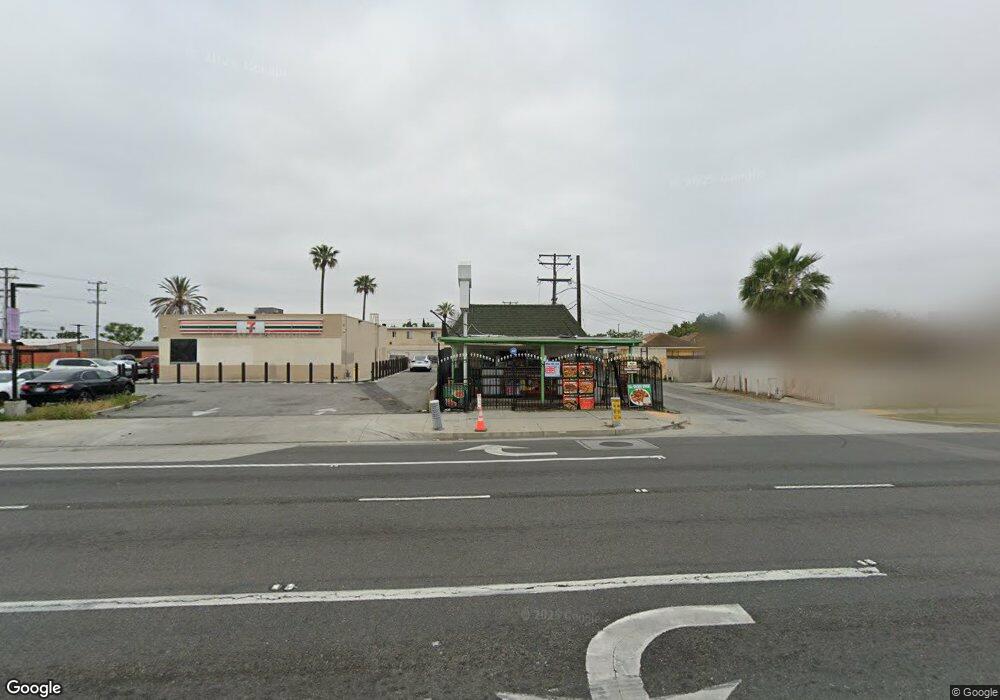
1116 E El Segundo Blvd Los Angeles, CA 90059
Estimated Value: $263,190
Studio
--
Bath
500
Sq Ft
$526/Sq Ft
Est. Value
About This Home
This home is located at 1116 E El Segundo Blvd, Los Angeles, CA 90059 and is currently estimated at $263,190, approximately $526 per square foot. 1116 E El Segundo Blvd is a home located in Los Angeles County with nearby schools including McKinley Elementary School, Enterprise Middle School, and Centennial High School.
Ownership History
Date
Name
Owned For
Owner Type
Purchase Details
Closed on
Apr 30, 2013
Sold by
Stennis Zelma R
Bought by
Stennis Zelma R and Zelma R Stennis Trust
Current Estimated Value
Purchase Details
Closed on
Oct 20, 2005
Sold by
O Shas Enterprise Llc
Bought by
Gordon Delbert
Purchase Details
Closed on
May 15, 1998
Sold by
Phillips Florence
Bought by
Williams Delores Louise
Home Financials for this Owner
Home Financials are based on the most recent Mortgage that was taken out on this home.
Original Mortgage
$99,335
Interest Rate
7.13%
Mortgage Type
Seller Take Back
Purchase Details
Closed on
Dec 29, 1997
Sold by
Williams Cliff
Bought by
Williams Delores Louise
Create a Home Valuation Report for This Property
The Home Valuation Report is an in-depth analysis detailing your home's value as well as a comparison with similar homes in the area
Home Values in the Area
Average Home Value in this Area
Purchase History
| Date | Buyer | Sale Price | Title Company |
|---|---|---|---|
| Stennis Zelma R | -- | None Available | |
| Gordon Delbert | $158,000 | Advantage Title Inc | |
| O Shas Enterprise Llc | -- | Advantage Title Inc | |
| Williams Delores Louise | $99,500 | Chicago Title Co | |
| Williams Delores Louise | -- | Chicago Title Co |
Source: Public Records
Mortgage History
| Date | Status | Borrower | Loan Amount |
|---|---|---|---|
| Previous Owner | Williams Delores Louise | $99,335 |
Source: Public Records
Tax History
| Year | Tax Paid | Tax Assessment Tax Assessment Total Assessment is a certain percentage of the fair market value that is determined by local assessors to be the total taxable value of land and additions on the property. | Land | Improvement |
|---|---|---|---|---|
| 2025 | $4,904 | $215,900 | $191,313 | $24,587 |
| 2024 | $4,904 | $211,667 | $187,562 | $24,105 |
| 2023 | $4,855 | $207,518 | $183,885 | $23,633 |
| 2022 | $4,641 | $203,450 | $180,280 | $23,170 |
| 2021 | $4,682 | $199,462 | $176,746 | $22,716 |
| 2019 | $4,582 | $193,548 | $171,504 | $22,044 |
| 2018 | $4,466 | $189,754 | $168,142 | $21,612 |
| 2017 | $4,361 | $186,035 | $164,846 | $21,189 |
| 2016 | $4,291 | $182,388 | $161,614 | $20,774 |
| 2015 | $4,140 | $179,649 | $159,187 | $20,462 |
| 2014 | $4,075 | $176,131 | $156,069 | $20,062 |
Source: Public Records
Map
Nearby Homes
- 2114 N Bahama Ave
- 1223 E 124th St
- 2109 N Bahama Ave
- 825 Sweetbay Ln
- 2015 N Belhaven Ave
- 12119 Alvaro St
- 1805 N Central Ave
- 12029 Belhaven St
- 13118 Stanford Ave
- 1950 N Bloom Dr
- 1918 W Piru St
- 1701 W 136th St
- 1619 W 136th St
- 1406 W Stockwell St
- 810 W 133rd St
- 1301 W 132nd St
- 13113 Avalon Blvd
- 1706 W 137th St
- 1209 W 136th St
- 1644 E 122nd St
- 12802 Belhaven Ave
- 12808 Belhaven Ave
- 12814 Belhaven Ave
- 12820 Belhaven Ave
- 12746 Belhaven Ave
- 12824 Belhaven Ave
- 12740 Belhaven Ave
- 12902 Belhaven Ave
- 12809 Belhaven Ave
- 12803 Belhaven Ave
- 12815 Belhaven Ave
- 12736 Belhaven Ave
- 12819 Belhaven Ave
- 12908 Belhaven Ave
- 12747 Belhaven Ave
- 12825 Belhaven Ave
- 12730 Belhaven Ave
- 12743 Belhaven Ave
- 12903 Belhaven Ave
- 12802 Clovis Ave
Your Personal Tour Guide
Ask me questions while you tour the home.