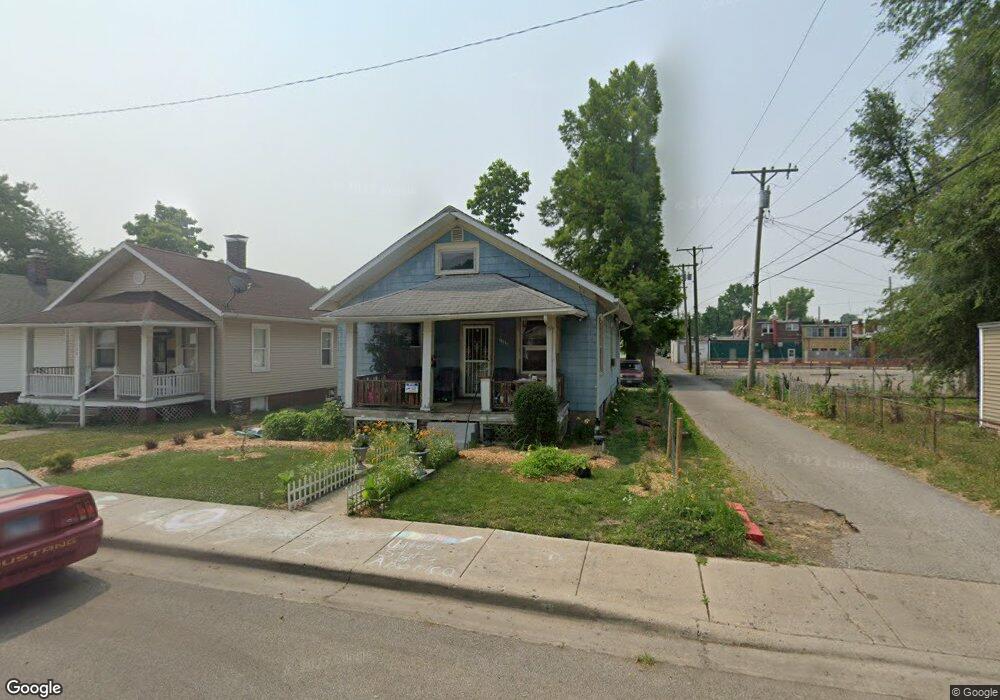
1116 E Oak St Springfield, IL 62703
Bunn Park NeighborhoodEstimated Value: $43,000 - $71,000
Studio
--
Bath
--
Sq Ft
5,227
Sq Ft Lot
About This Home
This home is located at 1116 E Oak St, Springfield, IL 62703 and is currently estimated at $53,677. 1116 E Oak St is a home located in Sangamon County with nearby schools including Butler Elementary School, Benjamin Franklin Middle School, and Springfield Southeast High School.
Ownership History
Date
Name
Owned For
Owner Type
Purchase Details
Closed on
Oct 2, 2025
Sold by
Peo Properties Llc Series 8
Bought by
Henderson Adam
Current Estimated Value
Purchase Details
Closed on
Sep 26, 2024
Sold by
Bt Properties Of Vermilion County Llc
Bought by
Peo Properties Llc Series 8
Purchase Details
Closed on
Oct 4, 2021
Sold by
County Clerk Of County Of Sangamon
Bought by
Bt Properties Of Vermilion County Llc
Purchase Details
Closed on
Feb 26, 2004
Purchase Details
Closed on
Feb 24, 2004
Purchase Details
Closed on
Nov 11, 1999
Create a Home Valuation Report for This Property
The Home Valuation Report is an in-depth analysis detailing your home's value as well as a comparison with similar homes in the area
Home Values in the Area
Average Home Value in this Area
Purchase History
| Date | Buyer | Sale Price | Title Company |
|---|---|---|---|
| Henderson Adam | $25,000 | None Listed On Document | |
| Peo Properties Llc Series 8 | -- | None Listed On Document | |
| Bt Properties Of Vermilion County Llc | -- | None Listed On Document | |
| -- | -- | -- | |
| -- | -- | -- | |
| -- | $21,000 | -- |
Source: Public Records
Tax History
| Year | Tax Paid | Tax Assessment Tax Assessment Total Assessment is a certain percentage of the fair market value that is determined by local assessors to be the total taxable value of land and additions on the property. | Land | Improvement |
|---|---|---|---|---|
| 2024 | $192 | $2,285 | $1,492 | $793 |
| 2023 | $185 | $2,087 | $1,363 | $724 |
| 2022 | $177 | $1,980 | $1,293 | $687 |
| 2021 | $172 | $1,906 | $1,245 | $661 |
| 2020 | $168 | $1,909 | $1,247 | $662 |
| 2019 | $165 | $1,903 | $1,243 | $660 |
| 2018 | $167 | $1,982 | $1,237 | $745 |
| 2017 | $164 | $1,956 | $1,221 | $735 |
| 2016 | $161 | $1,927 | $1,203 | $724 |
| 2015 | $159 | $1,904 | $1,189 | $715 |
| 2014 | $162 | $1,891 | $1,181 | $710 |
| 2013 | $158 | $1,951 | $1,180 | $771 |
Source: Public Records
Map
Nearby Homes
- 1942 S 11th St
- 2205 S 11th St
- 2160 S 14th St
- 2041 E Cedar St
- 725 E Spruce St
- 1622 E Cornell Ave
- 2339 S 10th St
- 2324 S 8th St
- 2176 S Martin Luther King Junior Dr
- 1838 S 19th St
- 2516 S 10th St
- 2517 S 10th St
- 1909 E Cedar St
- 2349 S 5th St
- 1933 S 1st St
- 709 Bryn Mawr Blvd Unit 1
- 1728 S Spring St
- 2001 S Spring St
- 1708 S Spring St
- Lot 1 & 2 Bunn Dr
Your Personal Tour Guide
Ask me questions while you tour the home.