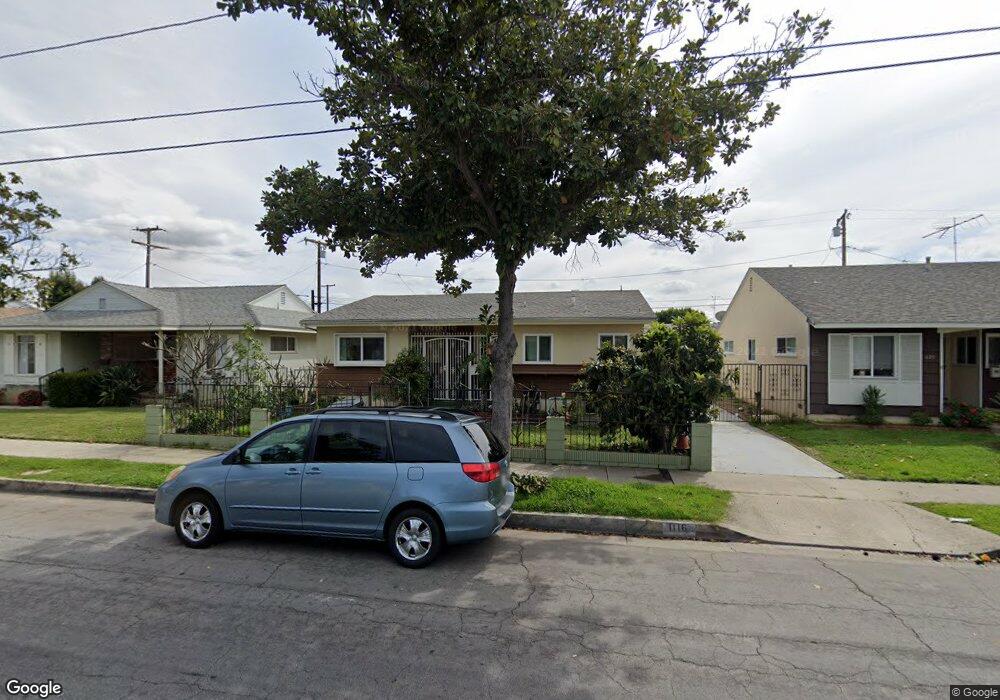
1116 S Montebello Blvd Montebello, CA 90640
Estimated Value: $721,000 - $868,000
3
Beds
2
Baths
1,285
Sq Ft
$619/Sq Ft
Est. Value
About This Home
This home is located at 1116 S Montebello Blvd, Montebello, CA 90640 and is currently estimated at $795,133, approximately $618 per square foot. 1116 S Montebello Blvd is a home located in Los Angeles County with nearby schools including Greenwood Elementary School, La Merced Intermediate School, and Montebello High School.
Ownership History
Date
Name
Owned For
Owner Type
Purchase Details
Closed on
Jul 5, 2023
Sold by
Jang Yuen Jang
Bought by
Yuen Jang Jang Living Trust and Jang
Current Estimated Value
Purchase Details
Closed on
Jan 8, 2015
Sold by
Wong Victor
Bought by
Jang Yuen Jang
Home Financials for this Owner
Home Financials are based on the most recent Mortgage that was taken out on this home.
Original Mortgage
$177,000
Interest Rate
3.75%
Mortgage Type
New Conventional
Purchase Details
Closed on
Jul 14, 2010
Sold by
Medina Ana L and The Honorina Chavez Living Tru
Bought by
Wong Victor and Jang Yuen Jang
Home Financials for this Owner
Home Financials are based on the most recent Mortgage that was taken out on this home.
Original Mortgage
$210,000
Interest Rate
4.51%
Mortgage Type
New Conventional
Purchase Details
Closed on
Nov 7, 2001
Sold by
Chavez Honorio
Bought by
Chavez Honorina and Honorina Chavez Living Trust
Create a Home Valuation Report for This Property
The Home Valuation Report is an in-depth analysis detailing your home's value as well as a comparison with similar homes in the area
Home Values in the Area
Average Home Value in this Area
Purchase History
| Date | Buyer | Sale Price | Title Company |
|---|---|---|---|
| Yuen Jang Jang Living Trust | -- | None Listed On Document | |
| Jang Yuen Jang | -- | Lawyers Title Company | |
| Wong Victor | $275,000 | North American Title Company | |
| Wong Victor | -- | North American Title Company | |
| Chavez Honorina | -- | -- |
Source: Public Records
Mortgage History
| Date | Status | Borrower | Loan Amount |
|---|---|---|---|
| Previous Owner | Jang Yuen Jang | $177,000 | |
| Previous Owner | Wong Victor | $210,000 |
Source: Public Records
Tax History Compared to Growth
Tax History
| Year | Tax Paid | Tax Assessment Tax Assessment Total Assessment is a certain percentage of the fair market value that is determined by local assessors to be the total taxable value of land and additions on the property. | Land | Improvement |
|---|---|---|---|---|
| 2025 | $5,414 | $352,308 | $242,134 | $110,174 |
| 2024 | $5,414 | $345,401 | $237,387 | $108,014 |
| 2023 | $5,392 | $338,630 | $232,733 | $105,897 |
| 2022 | $5,210 | $331,991 | $228,170 | $103,821 |
| 2021 | $5,023 | $325,483 | $223,697 | $101,786 |
| 2019 | $4,797 | $315,831 | $217,063 | $98,768 |
| 2018 | $4,796 | $309,639 | $212,807 | $96,832 |
| 2016 | $5,398 | $355,919 | $244,407 | $111,512 |
| 2015 | $4,445 | $293,148 | $201,473 | $91,675 |
| 2014 | $4,388 | $287,407 | $197,527 | $89,880 |
Source: Public Records
Map
Nearby Homes
- 740 Albee St
- 730 Frankel Ave Unit B9
- 1109 S Spruce St
- 1032 S Greenwood Ave
- 524 Washington Blvd
- 932 S Montebello Blvd
- 919 Carob Way
- 965 Acacia Ln
- 912 Jacmar Dr
- 757 S 4th St
- 859 W Carmelita Ave
- 637 Carmelita Place
- 6733 Candace Ave
- 816 W Mines Ave
- 552 S 6th St
- 862 W Mines Ave
- 630 S Maple Ave Unit 44
- 630 S Maple Ave Unit 7
- 522 S 5th St
- 1118 Calle Montana
- 1112 S Montebello Blvd
- 1120 S Montebello Blvd
- 733 Albee St
- 1108 S Montebello Blvd
- 1124 S Montebello Blvd
- 729 Albee St
- 737 Albee St
- 725 Albee St
- 1128 S Montebello Blvd
- 1106 S Montebello Blvd
- 1113 S Montebello Blvd
- 1117 S Montebello Blvd Unit 1
- 1117 S Montebello Blvd
- 1129 S Montebello Blvd
- 1121 S Montebello Blvd
- 1111 S Montebello Blvd
- 721 Albee St
- 1104 S Montebello Blvd
- 1132 S Montebello Blvd
- 1125 S Montebello Blvd