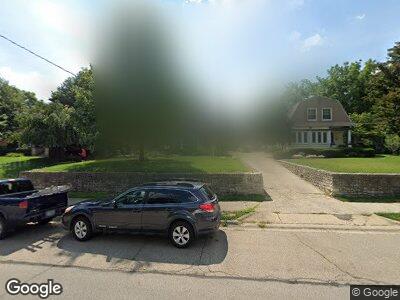
1117 Broadview Ave Columbus, OH 43212
Estimated Value: $747,695 - $1,228,000
3
Beds
2
Baths
2,243
Sq Ft
$402/Sq Ft
Est. Value
About This Home
This home is located at 1117 Broadview Ave, Columbus, OH 43212 and is currently estimated at $902,424, approximately $402 per square foot. 1117 Broadview Ave is a home located in Franklin County with nearby schools including Robert Louis Stevenson Elementary School, Larson Middle School, and Grandview Heights High School.
Ownership History
Date
Name
Owned For
Owner Type
Purchase Details
Closed on
Aug 28, 2015
Sold by
Yonkin Dsamuel W and Yonkin Jill C
Bought by
Kubina Joseph D and Kubina Jennifer L
Current Estimated Value
Home Financials for this Owner
Home Financials are based on the most recent Mortgage that was taken out on this home.
Original Mortgage
$417,000
Outstanding Balance
$333,521
Interest Rate
3.97%
Mortgage Type
New Conventional
Estimated Equity
$569,094
Purchase Details
Closed on
Jun 20, 2012
Sold by
Imler Dennis Jay and Imler Patricia Ann
Bought by
Youkin Sameul W and Youkin Jill C
Home Financials for this Owner
Home Financials are based on the most recent Mortgage that was taken out on this home.
Original Mortgage
$378,300
Interest Rate
3.83%
Mortgage Type
New Conventional
Purchase Details
Closed on
Aug 29, 1977
Bought by
Imler Dennis J
Create a Home Valuation Report for This Property
The Home Valuation Report is an in-depth analysis detailing your home's value as well as a comparison with similar homes in the area
Home Values in the Area
Average Home Value in this Area
Purchase History
| Date | Buyer | Sale Price | Title Company |
|---|---|---|---|
| Kubina Joseph D | $525,000 | Attorney | |
| Youkin Sameul W | -- | None Available | |
| Imler Dennis J | $54,000 | -- |
Source: Public Records
Mortgage History
| Date | Status | Borrower | Loan Amount |
|---|---|---|---|
| Open | Kubina Joseph D | $50,000 | |
| Open | Kubina Joseph D | $417,000 | |
| Previous Owner | Youkin Sameul W | $378,300 | |
| Previous Owner | Imler Dennis Jay | $44,719 | |
| Previous Owner | Imler Dennis Jay | $100,000 | |
| Previous Owner | Imler Dennis Jay | $45,000 | |
| Previous Owner | Imler Dennis Jay | $159,000 | |
| Previous Owner | Imler Dennis Jay | $30,000 | |
| Previous Owner | Imler Dennis J | $50,000 |
Source: Public Records
Tax History Compared to Growth
Tax History
| Year | Tax Paid | Tax Assessment Tax Assessment Total Assessment is a certain percentage of the fair market value that is determined by local assessors to be the total taxable value of land and additions on the property. | Land | Improvement |
|---|---|---|---|---|
| 2024 | $11,930 | $204,550 | $89,780 | $114,770 |
| 2023 | $10,451 | $204,540 | $89,775 | $114,765 |
| 2022 | $11,166 | $186,100 | $61,950 | $124,150 |
| 2021 | $10,454 | $186,100 | $61,950 | $124,150 |
| 2020 | $10,410 | $186,100 | $61,950 | $124,150 |
| 2019 | $10,493 | $166,010 | $61,950 | $104,060 |
| 2018 | $9,504 | $166,010 | $61,950 | $104,060 |
| 2017 | $9,172 | $166,010 | $61,950 | $104,060 |
| 2016 | $8,561 | $124,360 | $47,040 | $77,320 |
| 2015 | $8,561 | $124,360 | $47,040 | $77,320 |
| 2014 | $7,995 | $115,780 | $47,040 | $68,740 |
| 2013 | $3,512 | $105,245 | $42,770 | $62,475 |
Source: Public Records
Map
Nearby Homes
- 1000 Urlin Ave Unit 917
- 1000 Urlin Ave Unit 1407
- 1000 Urlin Ave Unit 1520
- 1000 Urlin Ave Unit 520
- 1000 Urlin Ave Unit 1608
- 1000 Urlin Ave Unit 2010
- 1000 Urlin Ave Unit 904
- 1000 Urlin Ave Unit 1611
- 1000 Urlin Ave Unit 1617
- 1000 Urlin Ave Unit 616
- 1000 Urlin Ave Unit 907
- 1000 Urlin Ave Unit 1811
- 1000 Urlin Ave Unit 1801
- 1000 Urlin Ave Unit 2017
- 1000 Urlin Ave Unit 2222
- 1422 W 2nd Ave
- 1353 Haines Ave
- 1345 Haines Ave
- 1333 Haines Ave
- 1324 Haines Ave
- 1117 Broadview Ave
- 1127 Broadview Ave
- 1115 Broadview Ave
- 1131 Broadview Ave
- 1111 Broadview Ave
- 1122 Fairview Ave
- 1122 Fairview Ave
- 1139 Broadview Ave
- 1143 Broadview Ave
- 1112 Fairview Ave
- 1116 Broadview Ave
- 1122 Broadview Ave
- 1114 Broadview Ave
- 1101 Broadview Ave
- 1112 Broadview Ave
- 1134 Broadview Ave
- 1153 Broadview Ave
- 1104 Broadview Ave
- 1146 Broadview Ave
- 1176 Fairview Ave