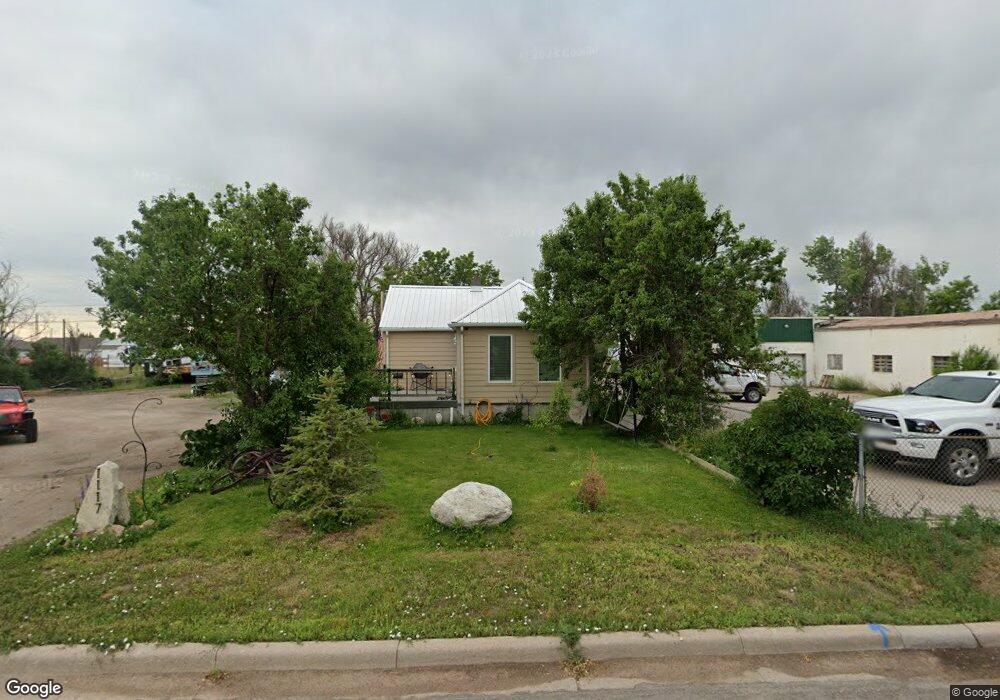
1117 E 8th St Cheyenne, WY 82007
South Cheyenne NeighborhoodEstimated Value: $240,000 - $262,845
Studio
--
Bath
820
Sq Ft
$305/Sq Ft
Est. Value
About This Home
This home is located at 1117 E 8th St, Cheyenne, WY 82007 and is currently estimated at $250,461, approximately $305 per square foot. 1117 E 8th St is a home located in Laramie County with nearby schools including Hebard Elementary School, Johnson Junior High School, and South High School.
Ownership History
Date
Name
Owned For
Owner Type
Purchase Details
Closed on
Jan 24, 2018
Sold by
Tammen Mary D
Bought by
Thomas H Mary D Tammen Living Trust and Tammen Mary D
Current Estimated Value
Purchase Details
Closed on
Oct 31, 2007
Sold by
Tammen Thomas H and Tammen Mary D
Bought by
Tammen Mary D
Home Financials for this Owner
Home Financials are based on the most recent Mortgage that was taken out on this home.
Original Mortgage
$87,550
Interest Rate
6.42%
Mortgage Type
New Conventional
Purchase Details
Closed on
Dec 20, 2004
Sold by
Tammen Mary D and Lemmons Thomas H
Bought by
Tammen Thomas H and Tammen Mary D
Purchase Details
Closed on
Dec 18, 1998
Sold by
Lemmons Diane
Bought by
Lemmons Mary Diane and Lemmons Diane
Home Financials for this Owner
Home Financials are based on the most recent Mortgage that was taken out on this home.
Original Mortgage
$39,550
Interest Rate
10.5%
Create a Home Valuation Report for This Property
The Home Valuation Report is an in-depth analysis detailing your home's value as well as a comparison with similar homes in the area
Home Values in the Area
Average Home Value in this Area
Purchase History
| Date | Buyer | Sale Price | Title Company |
|---|---|---|---|
| Thomas H Mary D Tammen Living Trust | -- | None Available | |
| Tammen Mary D | -- | None Available | |
| Tammen Thomas H | -- | -- | |
| Lemmons Mary Diane | -- | -- |
Source: Public Records
Mortgage History
| Date | Status | Borrower | Loan Amount |
|---|---|---|---|
| Closed | Tammen Mary D | $87,550 | |
| Closed | Lemmons Mary Diane | $39,550 |
Source: Public Records
Tax History
| Year | Tax Paid | Tax Assessment Tax Assessment Total Assessment is a certain percentage of the fair market value that is determined by local assessors to be the total taxable value of land and additions on the property. | Land | Improvement |
|---|---|---|---|---|
| 2025 | $1,566 | $17,074 | $2,404 | $14,670 |
| 2024 | $1,566 | $22,152 | $3,206 | $18,946 |
| 2023 | $1,515 | $21,430 | $3,206 | $18,224 |
| 2022 | $1,338 | $18,534 | $3,206 | $15,328 |
| 2021 | $1,227 | $16,955 | $3,206 | $13,749 |
| 2020 | $762 | $10,563 | $3,206 | $7,357 |
| 2019 | $719 | $9,956 | $3,206 | $6,750 |
| 2018 | $632 | $8,836 | $2,804 | $6,032 |
| 2017 | $564 | $7,818 | $1,854 | $5,964 |
| 2016 | $510 | $7,068 | $1,722 | $5,346 |
| 2015 | $453 | $6,278 | $1,722 | $4,556 |
| 2014 | $448 | $6,166 | $1,739 | $4,427 |
Source: Public Records
Map
Nearby Homes
- 1212 E 7th St
- 800 E 3rd St
- 807 E 3rd St
- 506 E 7th St
- 515 E 3rd St
- 2107 E 12th St
- 2415 E 10th St
- 714 E 15th St
- 701 E Lincolnway
- 2532 E 9th St
- 1605 E 16th St
- 1410 Carbon Ave Unit A-D
- 600 Central Ave
- 415 Wasatch St
- 1410 E 17th St
- 1717 Alexander Ave Unit 302
- 2621 E 10th St
- 1911 E 17th St
- 2709 E 9th St
- 802 E 18th St
Your Personal Tour Guide
Ask me questions while you tour the home.