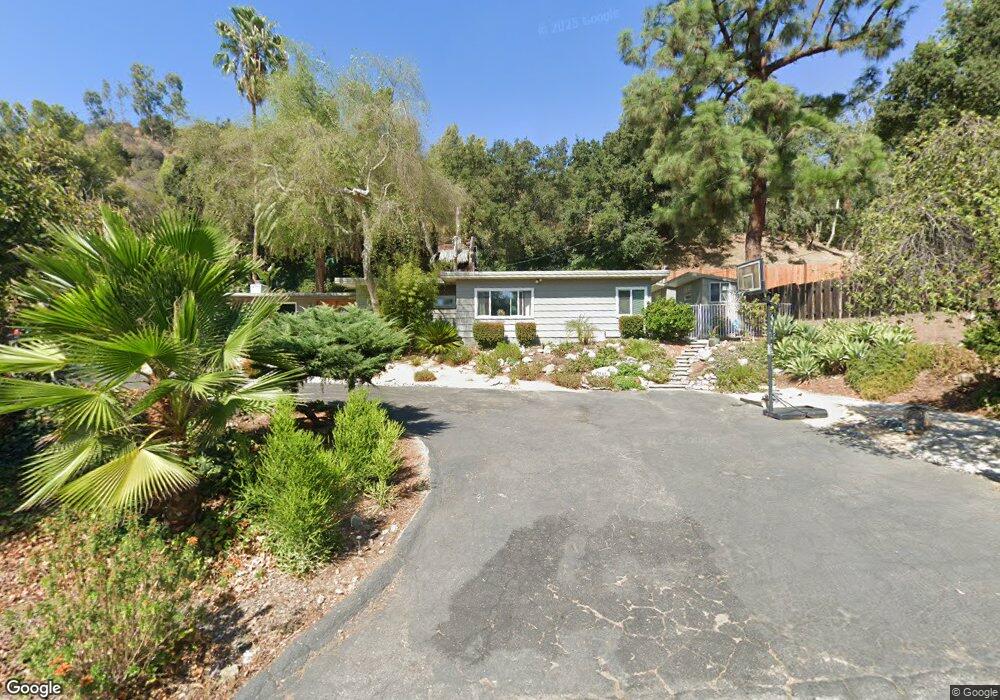
1117 Hicrest Rd Glendora, CA 91741
North Glendora NeighborhoodEstimated Value: $1,057,000 - $1,165,000
3
Beds
2
Baths
1,669
Sq Ft
$669/Sq Ft
Est. Value
About This Home
This home is located at 1117 Hicrest Rd, Glendora, CA 91741 and is currently estimated at $1,116,641, approximately $669 per square foot. 1117 Hicrest Rd is a home located in Los Angeles County with nearby schools including La Fetra Elementary School, Sandburg Middle School, and Glendora High School.
Ownership History
Date
Name
Owned For
Owner Type
Purchase Details
Closed on
Apr 18, 2011
Sold by
Us Bank National Association
Bought by
Flum Kim R and Kralik Dennis K
Current Estimated Value
Home Financials for this Owner
Home Financials are based on the most recent Mortgage that was taken out on this home.
Original Mortgage
$408,378
Interest Rate
3.87%
Mortgage Type
FHA
Purchase Details
Closed on
Jan 20, 2011
Sold by
Ngan Chor Chun
Bought by
Us Bank National Association
Purchase Details
Closed on
May 5, 2004
Sold by
Oei George
Bought by
Ngan Chor Chun
Home Financials for this Owner
Home Financials are based on the most recent Mortgage that was taken out on this home.
Original Mortgage
$536,000
Interest Rate
6.31%
Mortgage Type
Credit Line Revolving
Create a Home Valuation Report for This Property
The Home Valuation Report is an in-depth analysis detailing your home's value as well as a comparison with similar homes in the area
Home Values in the Area
Average Home Value in this Area
Purchase History
| Date | Buyer | Sale Price | Title Company |
|---|---|---|---|
| Flum Kim R | $419,000 | First American Title Company | |
| Us Bank National Association | $525,000 | Accommodation | |
| Ngan Chor Chun | -- | Southland Title | |
| Ngan Chor Chun | $670,000 | Southland Title |
Source: Public Records
Mortgage History
| Date | Status | Borrower | Loan Amount |
|---|---|---|---|
| Previous Owner | Flum Kim R | $408,378 | |
| Previous Owner | Ngan Chor Chun | $536,000 | |
| Closed | Ngan Chor Chun | $100,500 |
Source: Public Records
Tax History
| Year | Tax Paid | Tax Assessment Tax Assessment Total Assessment is a certain percentage of the fair market value that is determined by local assessors to be the total taxable value of land and additions on the property. | Land | Improvement |
|---|---|---|---|---|
| 2025 | $6,339 | $536,799 | $384,346 | $152,453 |
| 2024 | $6,339 | $526,274 | $376,810 | $149,464 |
| 2023 | $6,143 | $515,956 | $369,422 | $146,534 |
| 2022 | $5,974 | $505,840 | $362,179 | $143,661 |
| 2021 | $5,865 | $495,923 | $355,078 | $140,845 |
| 2019 | $5,526 | $481,216 | $344,548 | $136,668 |
| 2018 | $5,418 | $471,782 | $337,793 | $133,989 |
| 2016 | $5,193 | $453,464 | $324,677 | $128,787 |
| 2015 | $5,076 | $446,654 | $319,801 | $126,853 |
| 2014 | $5,082 | $437,906 | $313,537 | $124,369 |
Source: Public Records
Map
Nearby Homes
- 0 Ben Lomond Ave
- 569 N Barranca Ave
- 731 E Orange Blossom Way
- 349 N Marcile Ave
- 687 Lemon Swirl Dr
- 706 Lemon Swirl Dr
- 160 N Barranca Ave
- 877 Orchid Way
- 955 Sweetbriar Ln Unit E
- 665 E Tangerine St
- 837 Iris Way Unit C
- 908 N Bouquet Ct Unit F
- 638 E Tangerine St
- 579 Boxwood Ln
- 810 E Promenade Unit C
- 510 E Viewcrest Dr
- 807 E Laurel Oak Dr Unit 46
- 543 Canyon Heights Dr
- 1120 N Old Mill Rd
- 1116 N Old Mill Rd
- 1043 Hicrest Rd
- 1111 Hicrest Rd
- 1107 Hicrest Rd
- 1119 Hicrest Rd
- 1110 Hicrest Rd
- 1102 Hicrest Rd
- 1033 Hicrest Rd
- 1120 Hicrest Rd
- 1123 Hicrest Rd
- 1018 Hicrest Rd
- 1124 Hicrest Rd
- 1113 W Sierra Madre Ave
- 18829 Hicrest Rd
- 1113 W Sierra Madre Ave
- 18701 E Sierra Madre Ave
- 1047 Hicrest Rd
- 1101 W Sierra Madre Ave
- 1123 Sierra Madre Ave
- 18651 E Sierra Madre Ave
- 754 N Yucca Ridge Rd
Your Personal Tour Guide
Ask me questions while you tour the home.