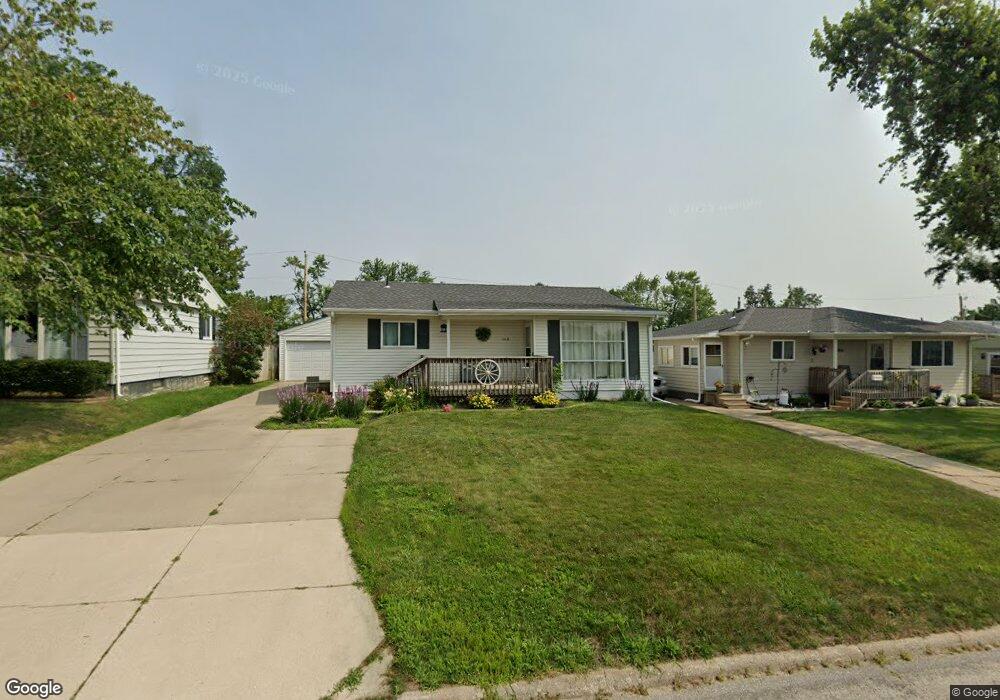
1118 Clifton St NE Cedar Rapids, IA 52402
Noelridge Park NeighborhoodEstimated Value: $192,000 - $196,000
3
Beds
1
Bath
1,652
Sq Ft
$117/Sq Ft
Est. Value
About This Home
This home is located at 1118 Clifton St NE, Cedar Rapids, IA 52402 and is currently estimated at $193,634, approximately $117 per square foot. 1118 Clifton St NE is a home located in Linn County with nearby schools including Wright Elementary School, Harding Middle School, and George Washington High School.
Ownership History
Date
Name
Owned For
Owner Type
Purchase Details
Closed on
May 28, 2020
Sold by
Dulle John H and Dulle Kari A
Bought by
Legrand Zacharia D
Current Estimated Value
Home Financials for this Owner
Home Financials are based on the most recent Mortgage that was taken out on this home.
Original Mortgage
$136,482
Outstanding Balance
$120,981
Interest Rate
3.2%
Mortgage Type
FHA
Estimated Equity
$72,653
Purchase Details
Closed on
Mar 14, 2005
Sold by
Black Ronald T and Black Michele P
Bought by
Dulle John H
Home Financials for this Owner
Home Financials are based on the most recent Mortgage that was taken out on this home.
Original Mortgage
$93,600
Interest Rate
5.25%
Mortgage Type
New Conventional
Purchase Details
Closed on
May 22, 2001
Sold by
Willey Bruce A and Willey Lynn A
Bought by
Black Ronald Todd and Black Michele Patrice
Home Financials for this Owner
Home Financials are based on the most recent Mortgage that was taken out on this home.
Original Mortgage
$92,625
Interest Rate
7.07%
Create a Home Valuation Report for This Property
The Home Valuation Report is an in-depth analysis detailing your home's value as well as a comparison with similar homes in the area
Home Values in the Area
Average Home Value in this Area
Purchase History
| Date | Buyer | Sale Price | Title Company |
|---|---|---|---|
| Legrand Zacharia D | $139,000 | None Available | |
| Dulle John H | $116,500 | -- | |
| Black Ronald Todd | $97,000 | -- |
Source: Public Records
Mortgage History
| Date | Status | Borrower | Loan Amount |
|---|---|---|---|
| Open | Legrand Zacharia D | $136,482 | |
| Previous Owner | Dulle John H | $93,600 | |
| Previous Owner | Black Ronald Todd | $92,625 |
Source: Public Records
Tax History Compared to Growth
Tax History
| Year | Tax Paid | Tax Assessment Tax Assessment Total Assessment is a certain percentage of the fair market value that is determined by local assessors to be the total taxable value of land and additions on the property. | Land | Improvement |
|---|---|---|---|---|
| 2025 | $2,788 | $184,000 | $29,100 | $154,900 |
| 2024 | $2,874 | $174,800 | $29,100 | $145,700 |
| 2023 | $2,874 | $168,000 | $25,200 | $142,800 |
| 2022 | $2,712 | $145,100 | $25,200 | $119,900 |
| 2021 | $2,586 | $139,900 | $21,200 | $118,700 |
| 2020 | $2,586 | $125,800 | $21,200 | $104,600 |
| 2019 | $2,492 | $115,600 | $21,200 | $94,400 |
| 2018 | $2,422 | $115,600 | $21,200 | $94,400 |
| 2017 | $2,353 | $110,700 | $21,200 | $89,500 |
| 2016 | $2,353 | $110,700 | $21,200 | $89,500 |
| 2015 | $2,461 | $115,633 | $31,777 | $83,856 |
| 2014 | $2,276 | $115,633 | $31,777 | $83,856 |
| 2013 | $2,222 | $115,633 | $31,777 | $83,856 |
Source: Public Records
Map
Nearby Homes
- 1048 Clifton St NE
- 1231 Miami Ct NE
- 4309 Benton St NE
- 143 40th St NE
- 1006 Messina Dr NE
- 1138 Messina Dr NE
- 3630 Oakland Rd NE
- 1114 35th St NE
- 1611 Hollywood Blvd NE
- 3724 F Ave NE
- 410 41st St NE
- 800 35th St NE
- 0 C Ave NE
- 530 37th St NE
- 3718 C Ave NE
- 1721 34th St NE
- 615 34th St NE
- 628 33rd St NE
- 115 Dawley St NE
- 2106 42nd St NE
- 1124 Clifton St NE
- 1112 Clifton St NE
- 1106 Clifton St NE
- 1117 Dover St NE
- 1123 Dover St NE
- 1111 Dover St NE
- 1105 Dover St NE
- 1129 Dover St NE
- 1136 Clifton St NE
- 1100 Clifton St NE
- 1123 Clifton St NE
- 1117 Clifton St NE
- 1135 Dover St NE
- 1111 Clifton St NE
- 1142 Clifton St NE
- 1052 Clifton St NE
- 1135 Clifton St NE
- 1141 Dover St NE
- 1015 Dover St NE
- 1148 Clifton St NE