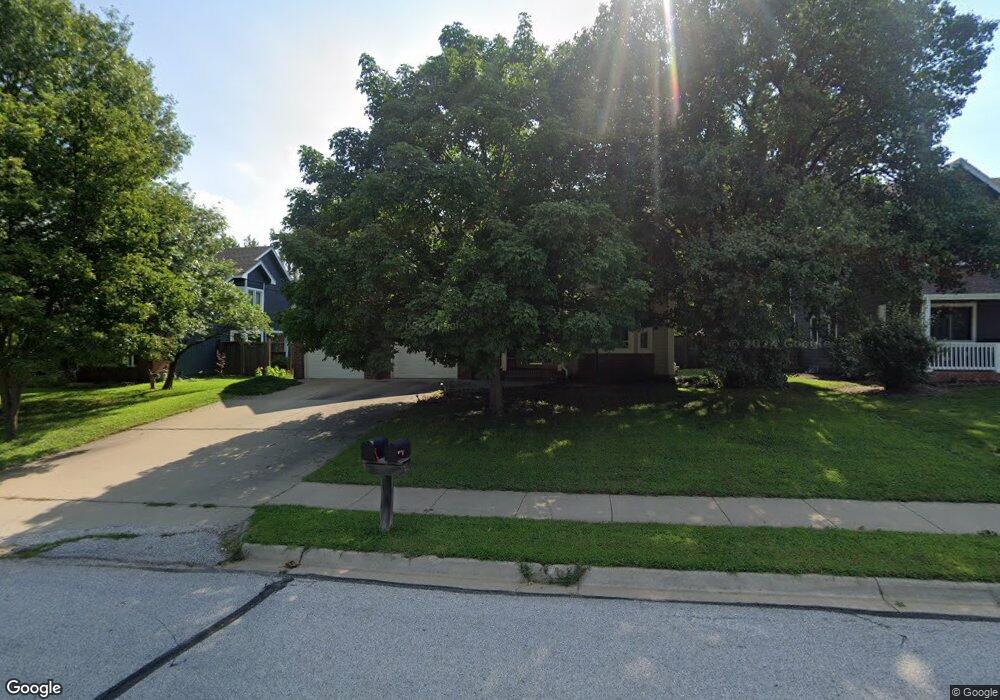
1118 Parkside Rd Lawrence, KS 66049
Perry Park NeighborhoodEstimated Value: $438,000 - $569,000
4
Beds
4
Baths
3,380
Sq Ft
$146/Sq Ft
Est. Value
About This Home
This home is located at 1118 Parkside Rd, Lawrence, KS 66049 and is currently estimated at $493,555, approximately $146 per square foot. 1118 Parkside Rd is a home located in Douglas County with nearby schools including Sunset Hill Elementary School, West Middle School, and Lawrence Free State High School.
Ownership History
Date
Name
Owned For
Owner Type
Purchase Details
Closed on
May 26, 2023
Sold by
Snow Kenneth R and Revoc Patricia
Bought by
Slam Properties Llc
Current Estimated Value
Purchase Details
Closed on
Jul 23, 2007
Sold by
Randall Robert Lee and Randall Elizabeth D
Bought by
Batterman Chet and Batterman Jill
Home Financials for this Owner
Home Financials are based on the most recent Mortgage that was taken out on this home.
Original Mortgage
$211,200
Interest Rate
6.63%
Mortgage Type
Purchase Money Mortgage
Purchase Details
Closed on
Nov 15, 2006
Sold by
Randall Robert Lee and Randall Elizabeth D
Bought by
Randall Robert L and Randall Elizabeth D
Home Financials for this Owner
Home Financials are based on the most recent Mortgage that was taken out on this home.
Original Mortgage
$70,000
Interest Rate
6.26%
Mortgage Type
Future Advance Clause Open End Mortgage
Create a Home Valuation Report for This Property
The Home Valuation Report is an in-depth analysis detailing your home's value as well as a comparison with similar homes in the area
Home Values in the Area
Average Home Value in this Area
Purchase History
| Date | Buyer | Sale Price | Title Company |
|---|---|---|---|
| Slam Properties Llc | -- | Eland Title Company Llc | |
| Batterman Chet | -- | Oread Land Title | |
| Randall Robert L | -- | Capital Title Ins Co Lc |
Source: Public Records
Mortgage History
| Date | Status | Borrower | Loan Amount |
|---|---|---|---|
| Previous Owner | Batterman Chet | $211,200 | |
| Previous Owner | Randall Robert L | $70,000 |
Source: Public Records
Tax History Compared to Growth
Tax History
| Year | Tax Paid | Tax Assessment Tax Assessment Total Assessment is a certain percentage of the fair market value that is determined by local assessors to be the total taxable value of land and additions on the property. | Land | Improvement |
|---|---|---|---|---|
| 2025 | $6,450 | $51,647 | $7,475 | $44,172 |
| 2024 | $6,346 | $50,807 | $5,750 | $45,057 |
| 2023 | $6,356 | $49,209 | $5,520 | $43,689 |
| 2022 | $5,705 | $43,919 | $4,830 | $39,089 |
| 2021 | $5,211 | $38,928 | $3,795 | $35,133 |
| 2020 | $5,125 | $38,484 | $3,795 | $34,689 |
| 2019 | $4,874 | $36,651 | $3,795 | $32,856 |
| 2018 | $4,781 | $35,696 | $3,680 | $32,016 |
| 2017 | $4,806 | $35,478 | $3,680 | $31,798 |
| 2016 | $4,819 | $37,145 | $3,680 | $33,465 |
| 2015 | $3,960 | $30,579 | $3,680 | $26,899 |
| 2014 | $3,399 | $26,554 | $3,680 | $22,874 |
Source: Public Records
Map
Nearby Homes
- 1168 Parkside Cir
- 1021 Holiday Dr
- 3507 W 10th St
- 3510 W 9th Ct
- 1304 Lawrence Ave
- 1215 Hacienda Ln
- 1507 Medinah Cir
- 1008 Lawrence Ave
- 1014 Lawrence Ave
- 3922 Willshire Dr
- 1439 Applegate Ct
- 1113 Somerset Cir
- 1012 Wagon Wheel Rd
- 4207 Timberline Ct
- 1204 Chadwick Ct
- 611 Eldridge St
- 1406 Brighton Cir Unit B
- 1432 Stone Meadows Dr
- 2901 University Dr
- 2901 University Dr Unit A, B, C, D, E, F
- 1122 Parkside Rd
- 1114 Parkside Rd
- 1121 Parkside Cir
- 1125 Parkside Cir
- 1117 Parkside Cir
- 1110 Parkside Rd
- 1126 Parkside Rd
- 1113 Parkside Cir
- 1129 Parkside Cir
- 1106 Parkside Rd
- 1109 Parkside Cir
- 1140 Parkside Cir
- 1136 Parkside Cir
- 1144 Parkside Cir
- 1132 Parkside Cir
- 1101 Parkside Cir
- 1148 Parkside Cir
- 1128 Parkside Cir
- 1164 Parkside Cir
- 1105 Parkside Cir