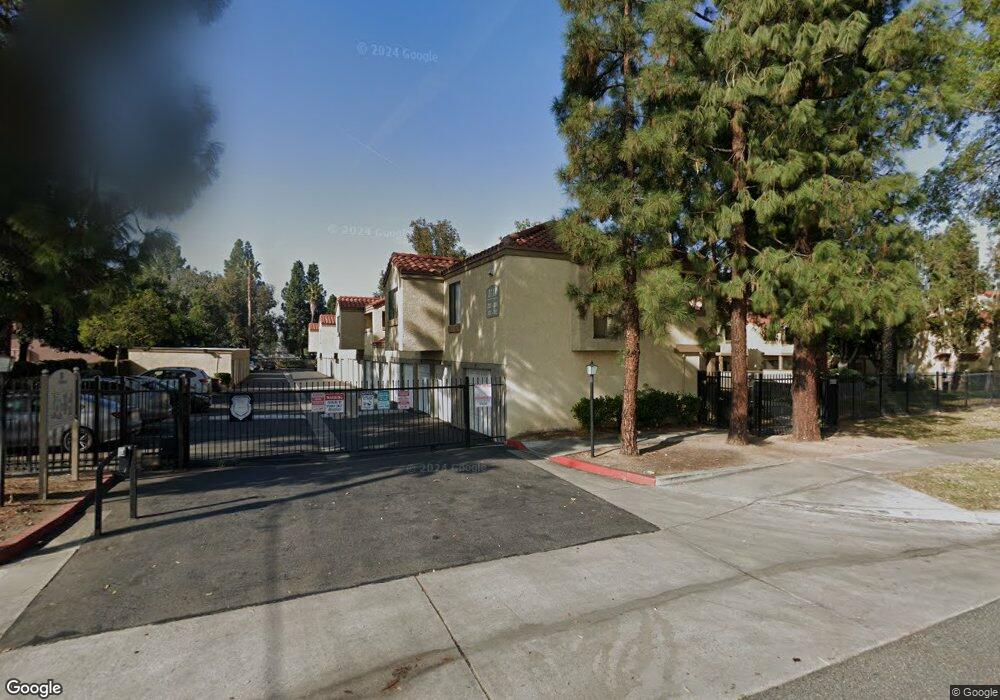
1118 W Blaine St Unit 101 Riverside, CA 92507
University NeighborhoodEstimated Value: $307,765 - $318,000
1
Bed
1
Bath
616
Sq Ft
$508/Sq Ft
Est. Value
About This Home
This home is located at 1118 W Blaine St Unit 101, Riverside, CA 92507 and is currently estimated at $312,941, approximately $508 per square foot. 1118 W Blaine St Unit 101 is a home located in Riverside County with nearby schools including Highland Elementary, University Heights Middle School, and John W. North High School.
Ownership History
Date
Name
Owned For
Owner Type
Purchase Details
Closed on
Jul 11, 2023
Sold by
Bair Jongke
Bought by
Lin Fangba and Bair Jongke
Current Estimated Value
Home Financials for this Owner
Home Financials are based on the most recent Mortgage that was taken out on this home.
Original Mortgage
$156,000
Outstanding Balance
$152,279
Interest Rate
6.79%
Mortgage Type
New Conventional
Estimated Equity
$160,662
Purchase Details
Closed on
Jun 8, 2011
Sold by
Lin Fang Ba
Bought by
Bair Jongke
Purchase Details
Closed on
Jun 2, 2011
Sold by
Cryder Brandon T and Harthcock Cryder Kathleen
Bought by
Bair Jongke
Purchase Details
Closed on
Sep 21, 2005
Sold by
West Blaine Street Lp
Bought by
Cryder Brandon T and Harthcock Cryder Kathleen
Home Financials for this Owner
Home Financials are based on the most recent Mortgage that was taken out on this home.
Original Mortgage
$126,300
Interest Rate
6.62%
Mortgage Type
Fannie Mae Freddie Mac
Create a Home Valuation Report for This Property
The Home Valuation Report is an in-depth analysis detailing your home's value as well as a comparison with similar homes in the area
Home Values in the Area
Average Home Value in this Area
Purchase History
| Date | Buyer | Sale Price | Title Company |
|---|---|---|---|
| Lin Fangba | -- | None Listed On Document | |
| Bair Jongke | -- | First American Title Company | |
| Bair Jongke | $68,000 | First American Title Company | |
| Cryder Brandon T | $158,000 | Stewart Title Of Ca Inc |
Source: Public Records
Mortgage History
| Date | Status | Borrower | Loan Amount |
|---|---|---|---|
| Open | Lin Fangba | $156,000 | |
| Previous Owner | Cryder Brandon T | $126,300 |
Source: Public Records
Tax History Compared to Growth
Tax History
| Year | Tax Paid | Tax Assessment Tax Assessment Total Assessment is a certain percentage of the fair market value that is determined by local assessors to be the total taxable value of land and additions on the property. | Land | Improvement |
|---|---|---|---|---|
| 2025 | $989 | $87,106 | $38,429 | $48,677 |
| 2023 | $989 | $83,726 | $36,939 | $46,787 |
| 2022 | $968 | $82,085 | $36,215 | $45,870 |
| 2021 | $971 | $80,476 | $35,505 | $44,971 |
| 2020 | $964 | $79,651 | $35,141 | $44,510 |
| 2019 | $947 | $78,090 | $34,452 | $43,638 |
| 2018 | $929 | $76,560 | $33,777 | $42,783 |
| 2017 | $914 | $75,060 | $33,115 | $41,945 |
| 2016 | $858 | $73,589 | $32,466 | $41,123 |
| 2015 | $845 | $72,485 | $31,979 | $40,506 |
| 2014 | $836 | $71,066 | $31,353 | $39,713 |
Source: Public Records
Map
Nearby Homes
- 1114 W Blaine St Unit 108
- 1142 W Blaine St Unit 201
- 1110 W Blaine St Unit 102
- 1140 W Blaine St Unit 202
- 1050 Athena Ct
- 1311 Massachusetts Ave Unit 203
- 2891 Canyon Crest Dr
- 36 Round Table Dr
- 1313 Massachusetts Ave Unit 201
- 1329 Massachusetts Ave Unit 202
- 1315 Massachusetts Ave Unit 204
- 39 Round Table Dr
- 1560 Massachusetts Ave Unit 123
- 1560 Massachusetts Ave Unit 142
- 1560 Massachusetts Ave Unit 34
- 1560 Massachusetts Ave
- 1560 Massachusetts Ave Unit 46
- 1317 Massachusetts Ave Unit 202
- 3681 Cranford Ave
- 1341 Massachusetts Ave Unit 205
- 1118 W Blaine St Unit 102
- 1118 W Blaine St Unit 204
- 1118 W Blaine St Unit 203
- 1118 W Blaine St Unit 202
- 1118 W Blaine St Unit 201
- 1116 W Blaine St Unit 104
- 1116 W Blaine St Unit 102
- 1116 W Blaine St Unit 203
- 1116 W Blaine St Unit 103
- 1116 W Blaine St Unit 101
- 1116 W Blaine St Unit 204
- 1116 W Blaine St Unit 202
- 1116 W Blaine St Unit 201
- 1146 W Blaine St Unit 204
- 1146 W Blaine St Unit 202
- 1146 W Blaine St Unit 201
- 1146 W Blaine St Unit 102
- 1146 W Blaine St Unit 101
- 1146 W Blaine St Unit 203
- 3411 Rustin Ave