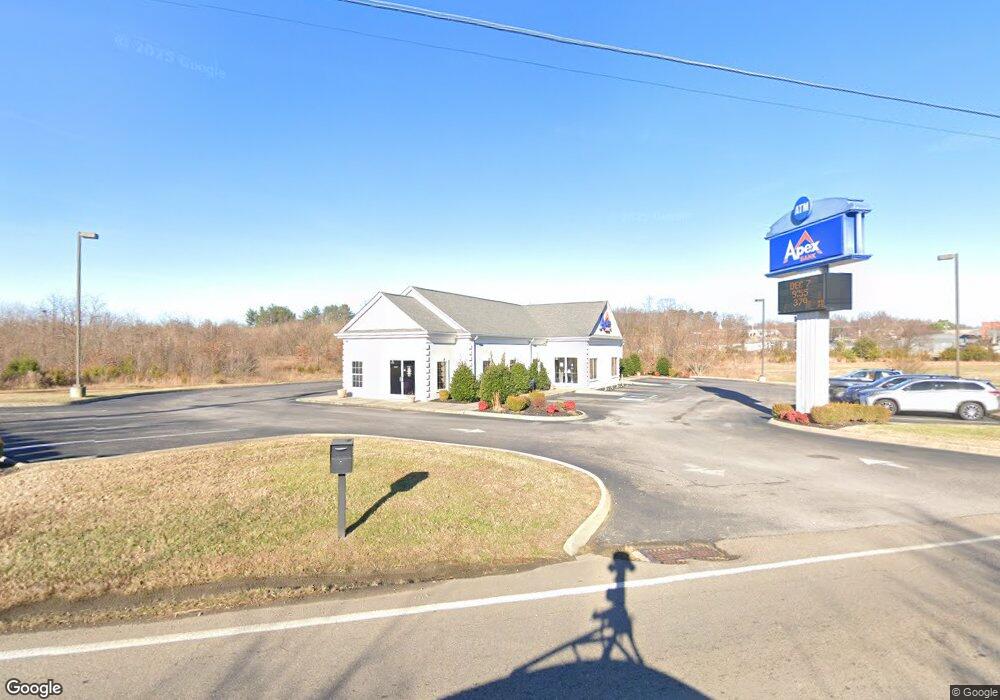
1118 W Main St Greeneville, TN 37743
Estimated Value: $1,195,550
--
Bed
1
Bath
2,436
Sq Ft
$491/Sq Ft
Est. Value
About This Home
This home is located at 1118 W Main St, Greeneville, TN 37743 and is currently estimated at $1,195,550, approximately $490 per square foot. 1118 W Main St is a home located in Greene County with nearby schools including Greeneville Middle School, Greeneville High School, and Greeneville Adventist Academy.
Ownership History
Date
Name
Owned For
Owner Type
Purchase Details
Closed on
Jun 29, 2009
Sold by
Allenall Enterprises Inc
Bought by
American Patriot Bank
Current Estimated Value
Purchase Details
Closed on
Sep 24, 2007
Sold by
Tennessee Star Llc
Bought by
Allenall Enterprises Inc
Home Financials for this Owner
Home Financials are based on the most recent Mortgage that was taken out on this home.
Original Mortgage
$456,664
Interest Rate
6.49%
Mortgage Type
Commercial
Purchase Details
Closed on
Nov 8, 2005
Sold by
Macon Milton
Bought by
Tennessee Star Llc
Purchase Details
Closed on
Oct 11, 1991
Bought by
Greene James C
Create a Home Valuation Report for This Property
The Home Valuation Report is an in-depth analysis detailing your home's value as well as a comparison with similar homes in the area
Home Values in the Area
Average Home Value in this Area
Purchase History
| Date | Buyer | Sale Price | Title Company |
|---|---|---|---|
| American Patriot Bank | $449,020 | -- | |
| Allenall Enterprises Inc | $450,000 | -- | |
| Tennessee Star Llc | $320,000 | -- | |
| Greene James C | $125,000 | -- |
Source: Public Records
Mortgage History
| Date | Status | Borrower | Loan Amount |
|---|---|---|---|
| Previous Owner | Greene James C | $456,664 |
Source: Public Records
Tax History Compared to Growth
Tax History
| Year | Tax Paid | Tax Assessment Tax Assessment Total Assessment is a certain percentage of the fair market value that is determined by local assessors to be the total taxable value of land and additions on the property. | Land | Improvement |
|---|---|---|---|---|
| 2024 | $9,334 | $284,560 | $82,120 | $202,440 |
| 2023 | $9,716 | $284,560 | $0 | $0 |
| 2022 | $1,009,400 | $242,520 | $74,680 | $167,840 |
| 2021 | $10,094 | $242,520 | $74,680 | $167,840 |
| 2020 | $10,094 | $242,520 | $74,680 | $167,840 |
| 2019 | $10,094 | $242,520 | $74,680 | $167,840 |
| 2018 | $9,780 | $242,520 | $74,680 | $167,840 |
| 2017 | $8,841 | $222,320 | $71,320 | $151,000 |
| 2016 | $8,618 | $222,320 | $71,320 | $151,000 |
| 2015 | $8,618 | $222,320 | $71,320 | $151,000 |
| 2014 | $8,241 | $222,320 | $71,320 | $151,000 |
Source: Public Records
Map
Nearby Homes