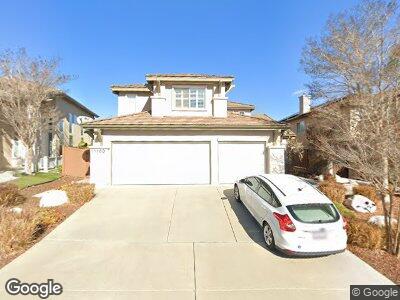
11180 Oak Fern Ct Unit 11 San Diego, CA 92131
Miramar Ranch North NeighborhoodEstimated Value: $1,849,226 - $1,972,000
5
Beds
3
Baths
2,680
Sq Ft
$718/Sq Ft
Est. Value
About This Home
This home is located at 11180 Oak Fern Ct Unit 11, San Diego, CA 92131 and is currently estimated at $1,923,057, approximately $717 per square foot. 11180 Oak Fern Ct Unit 11 is a home located in San Diego County with nearby schools including Dingeman Elementary School, Thurgood Marshall Middle School, and Scripps Ranch High School.
Ownership History
Date
Name
Owned For
Owner Type
Purchase Details
Closed on
Apr 24, 2003
Sold by
Reid Jerome N
Bought by
Kaup Jchn T and Kaup Sara J
Current Estimated Value
Home Financials for this Owner
Home Financials are based on the most recent Mortgage that was taken out on this home.
Original Mortgage
$385,000
Interest Rate
5.71%
Purchase Details
Closed on
Dec 4, 1996
Sold by
Shea Homes Ltd Partnership
Bought by
Reid Jerome N
Home Financials for this Owner
Home Financials are based on the most recent Mortgage that was taken out on this home.
Original Mortgage
$253,800
Interest Rate
7.5%
Create a Home Valuation Report for This Property
The Home Valuation Report is an in-depth analysis detailing your home's value as well as a comparison with similar homes in the area
Home Values in the Area
Average Home Value in this Area
Purchase History
| Date | Buyer | Sale Price | Title Company |
|---|---|---|---|
| Kaup Jchn T | $615,000 | Commonwealth Land Title Insu | |
| Reid Jerome N | $317,500 | First American Title |
Source: Public Records
Mortgage History
| Date | Status | Borrower | Loan Amount |
|---|---|---|---|
| Open | Kaup John T | $281,000 | |
| Closed | Kaup John T | $342,000 | |
| Closed | Kaup John T | $372,500 | |
| Closed | Kaup John T | $125,000 | |
| Closed | Kaup John T | $28,700 | |
| Closed | Kaup Jchn T | $385,000 | |
| Previous Owner | Reid Jerome N | $240,000 | |
| Previous Owner | Reid Jerome N | $277,500 | |
| Previous Owner | Reid Jerome N | $253,800 | |
| Closed | Reid Jerome N | $31,700 |
Source: Public Records
Tax History Compared to Growth
Tax History
| Year | Tax Paid | Tax Assessment Tax Assessment Total Assessment is a certain percentage of the fair market value that is determined by local assessors to be the total taxable value of land and additions on the property. | Land | Improvement |
|---|---|---|---|---|
| 2024 | $11,056 | $873,240 | $241,380 | $631,860 |
| 2023 | $10,801 | $856,119 | $236,648 | $619,471 |
| 2022 | $10,449 | $839,333 | $232,008 | $607,325 |
| 2021 | $10,364 | $822,876 | $227,459 | $595,417 |
| 2020 | $10,241 | $814,439 | $225,127 | $589,312 |
| 2019 | $10,477 | $798,470 | $220,713 | $577,757 |
| 2018 | $10,783 | $782,815 | $216,386 | $566,429 |
| 2017 | $80 | $767,467 | $212,144 | $555,323 |
| 2016 | $10,440 | $752,420 | $207,985 | $544,435 |
| 2015 | $10,308 | $741,119 | $204,861 | $536,258 |
| 2014 | $10,159 | $726,603 | $200,849 | $525,754 |
Source: Public Records
Map
Nearby Homes
- 11645 Spruce Run Dr
- 11561 Spruce Run Dr
- 11580 Wannacut Place Unit 7
- 11107 Doverhill Rd
- 10941 Waterton Rd
- 10928 Waterton Rd
- 11115 Gatemoore Way
- 11898 Cypress Canyon Rd Unit 1
- 11004 Caminito Arcada
- 11542 Village Ridge Rd
- 10863 Canarywood Ct
- 11680 Alderhill Terrace
- 10655 Cassowary Ct
- 10784 Sunset Ridge Dr
- 10948 Ivy Hill Dr Unit 8
- 11891 Ramsdell Ct
- 10618 Wincheck Rd
- 11766 Clearwood Ct
- 11523 Sun Ray Ct
- 10695 Wexford St Unit 2
- 11180 Oak Fern Ct Unit 11
- 11174 Oak Fern Ct
- 11192 Oak Fern Ct
- 11588 Wills Creek Rd
- 11602 Wills Creek Rd
- 11189 Oak Fern Ct Unit 11
- 11173 Oak Fern Ct
- 11205 Walking Fern Cove
- 11555 Wills Creek Rd Unit 11
- 11579 Wills Creek Rd
- 11618 Wills Creek Rd
- 11547 Wills Creek Rd
- 11211 Walking Fern Cove
- 11537 Wills Creek Rd
- 11626 Wills Creek Rd
- 11223 Walking Fern Cove
- 11520 Wills Creek Rd
- 11212 Walking Fern Cove
- 11529 Wills Creek Rd