Estimated Value: $183,526 - $302,000
3
Beds
1
Bath
1,832
Sq Ft
$132/Sq Ft
Est. Value
About This Home
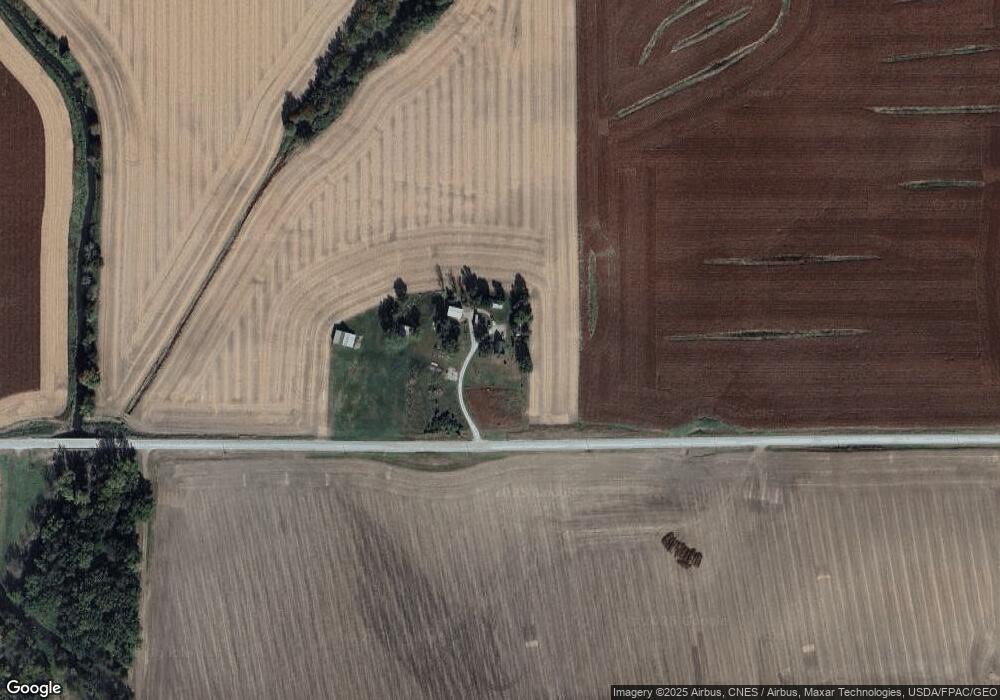
This home is located at 1119 110th St, Pella, IA 50219 and is currently estimated at $242,382, approximately $132 per square foot. 1119 110th St is a home located in Mahaska County with nearby schools including Pella High School.
Ownership History
Date
Name
Owned For
Owner Type
Purchase Details
Closed on
Sep 23, 2020
Sold by
Top Leslie R and Top Onita J
Bought by
Rook Nacy L and Rook Megan M
Current Estimated Value
Home Financials for this Owner
Home Financials are based on the most recent Mortgage that was taken out on this home.
Original Mortgage
$104,500
Outstanding Balance
$92,737
Interest Rate
2.9%
Mortgage Type
New Conventional
Estimated Equity
$149,645
Purchase Details
Closed on
Dec 18, 2008
Sold by
Federal National Mortgage Association
Bought by
Top Leslie R and Top Onita J
Purchase Details
Closed on
Apr 15, 2008
Sold by
Wilson Robert B and Wilson Cathy L
Bought by
Nationwide Advantage Mortgage Company
Create a Home Valuation Report for This Property
The Home Valuation Report is an in-depth analysis detailing your home's value as well as a comparison with similar homes in the area
Home Values in the Area
Average Home Value in this Area
Purchase History
| Date | Buyer | Sale Price | Title Company |
|---|---|---|---|
| Rook Nacy L | $110,000 | None Available | |
| Top Leslie R | -- | None Available | |
| Nationwide Advantage Mortgage Company | $103,242 | None Available |
Source: Public Records
Mortgage History
| Date | Status | Borrower | Loan Amount |
|---|---|---|---|
| Open | Rook Nacy L | $104,500 |
Source: Public Records
Tax History Compared to Growth
Tax History
| Year | Tax Paid | Tax Assessment Tax Assessment Total Assessment is a certain percentage of the fair market value that is determined by local assessors to be the total taxable value of land and additions on the property. | Land | Improvement |
|---|---|---|---|---|
| 2025 | $2,042 | $170,290 | $55,660 | $114,630 |
| 2024 | $2,042 | $161,420 | $55,660 | $105,760 |
| 2023 | $2,112 | $161,420 | $55,660 | $105,760 |
| 2022 | $2,096 | $134,840 | $55,660 | $79,180 |
| 2021 | $2,010 | $134,840 | $55,660 | $79,180 |
| 2020 | $2,010 | $123,310 | $44,130 | $79,180 |
| 2019 | $1,872 | $114,180 | $0 | $0 |
| 2018 | $1,872 | $114,180 | $0 | $0 |
| 2017 | $1,880 | $114,180 | $0 | $0 |
| 2016 | $1,836 | $114,180 | $0 | $0 |
| 2015 | $1,836 | $114,180 | $0 | $0 |
| 2014 | $1,712 | $114,180 | $0 | $0 |
Source: Public Records
Map
Nearby Homes