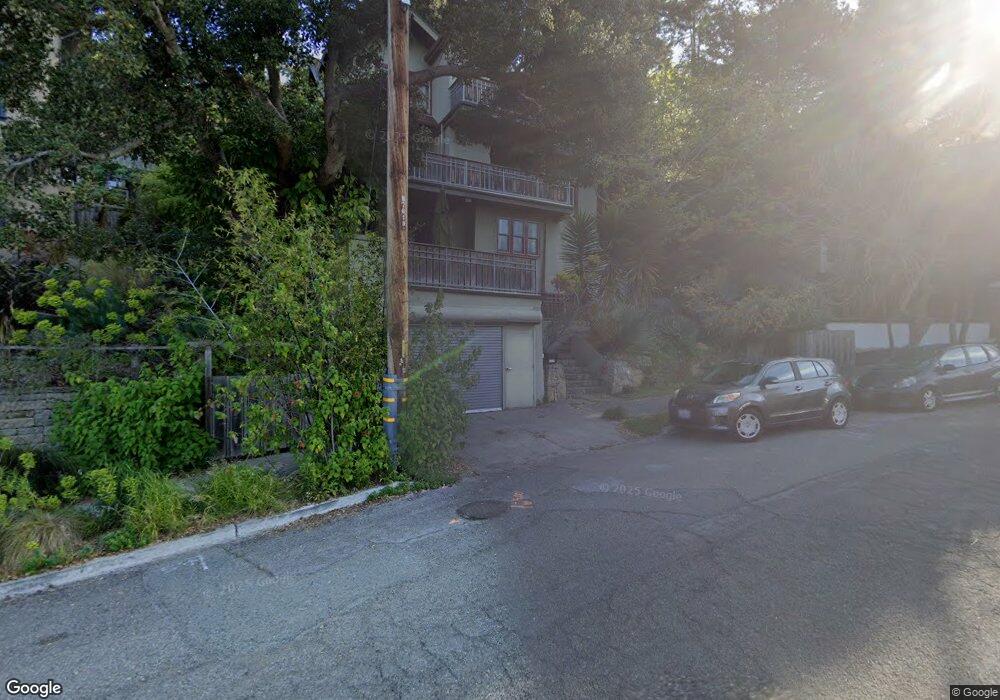
1119 Arch St Berkeley, CA 94708
Berkeley Hills NeighborhoodEstimated Value: $1,498,000 - $1,823,000
4
Beds
2
Baths
2,000
Sq Ft
$817/Sq Ft
Est. Value
About This Home
This home is located at 1119 Arch St, Berkeley, CA 94708 and is currently estimated at $1,634,728, approximately $817 per square foot. 1119 Arch St is a home located in Alameda County with nearby schools including Cragmont Elementary School, Berkeley Arts Magnet at Whittier School, and Washington Elementary School.
Ownership History
Date
Name
Owned For
Owner Type
Purchase Details
Closed on
Jun 1, 2023
Sold by
Bonomi Pietro
Bought by
Bonomi Pietro and Whitmore Susan
Current Estimated Value
Purchase Details
Closed on
Mar 10, 2003
Sold by
Viadro Mary J and Viadro Chris
Bought by
Bonomi Pietro and Reuther Catherine V
Home Financials for this Owner
Home Financials are based on the most recent Mortgage that was taken out on this home.
Original Mortgage
$235,000
Interest Rate
5.83%
Create a Home Valuation Report for This Property
The Home Valuation Report is an in-depth analysis detailing your home's value as well as a comparison with similar homes in the area
Home Values in the Area
Average Home Value in this Area
Purchase History
| Date | Buyer | Sale Price | Title Company |
|---|---|---|---|
| Bonomi Pietro | -- | None Listed On Document | |
| Bonomi Pietro | $435,000 | First American Title Company |
Source: Public Records
Mortgage History
| Date | Status | Borrower | Loan Amount |
|---|---|---|---|
| Previous Owner | Bonomi Pietro | $235,000 |
Source: Public Records
Tax History
| Year | Tax Paid | Tax Assessment Tax Assessment Total Assessment is a certain percentage of the fair market value that is determined by local assessors to be the total taxable value of land and additions on the property. | Land | Improvement |
|---|---|---|---|---|
| 2025 | $12,649 | $639,744 | $289,640 | $357,104 |
| 2024 | $12,649 | $627,065 | $283,962 | $350,103 |
| 2023 | $12,353 | $614,637 | $278,396 | $343,241 |
| 2022 | $12,059 | $602,450 | $272,938 | $336,512 |
| 2021 | $11,889 | $575,003 | $267,588 | $314,415 |
| 2020 | $10,881 | $576,040 | $264,846 | $311,194 |
| 2019 | $10,260 | $564,747 | $259,654 | $305,093 |
| 2018 | $10,046 | $553,676 | $254,564 | $299,112 |
| 2017 | $9,687 | $542,823 | $249,574 | $293,249 |
| 2016 | $9,250 | $532,183 | $244,682 | $287,501 |
| 2015 | $9,106 | $524,192 | $241,008 | $283,184 |
| 2014 | $8,944 | $513,926 | $236,288 | $277,638 |
Source: Public Records
Map
Nearby Homes
- 1004 Cragmont Ave
- 2315 Eunice St
- 938 San Benito Rd
- 2121 Eunice St
- 1106 Cragmont Ave
- 962 Regal Rd
- 1165 Cragmont Ave
- 1950 Hopkins St
- 2501 Rose Walk
- 2686 Shasta Rd
- 813 San Diego Rd
- 1155 Keeler Ave
- 1110 Sterling Ave
- 1024 Grizzly Peak Blvd
- 777 Cragmont Ave
- 758 Spruce St
- 1085 Creston Rd
- 935 Grizzly Peak Blvd
- 1160 Miller Ave
- 1444 Walnut St
Your Personal Tour Guide
Ask me questions while you tour the home.