
Seller's Agent in 2012
Deb Haussmann
KW 1Advantage
(563) 343-4747
12 in this area
151 Total Sales


Estimated Value: $89,000 - $125,000
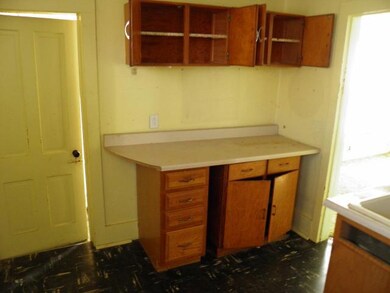
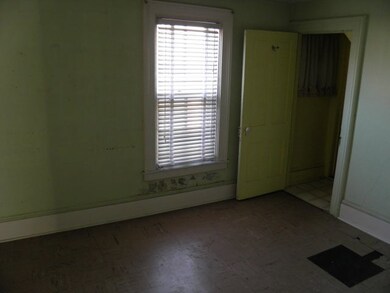
Property being sold "as-is" condition. Buyer/buyer agent to verify condition and measurements of property.
Last Agent to Sell the Property
KW 1Advantage License #B44293000/471.021466 Listed on: 02/13/2012
Last Buyer's Agent
Chris Pace
Keller Williams Greater Quad Cities / Midwest Partners License #475.132314/S60163000
| Date | Buyer | Sale Price | Title Company |
|---|---|---|---|
| Aldershof Patrick A | $18,900 | Servicelink |
| Date | Event | Price | List to Sale | Price per Sq Ft |
|---|---|---|---|---|
| 05/17/2012 05/17/12 | Sold | $18,900 | -36.8% | $13 / Sq Ft |
| 04/18/2012 04/18/12 | Pending | -- | -- | -- |
| 02/13/2012 02/13/12 | For Sale | $29,900 | -- | $20 / Sq Ft |
| Year | Tax Paid | Tax Assessment Tax Assessment Total Assessment is a certain percentage of the fair market value that is determined by local assessors to be the total taxable value of land and additions on the property. | Land | Improvement |
|---|---|---|---|---|
| 2025 | $1,370 | $93,960 | $19,160 | $74,800 |
| 2024 | $1,338 | $76,700 | $19,160 | $57,540 |
| 2023 | $1,254 | $76,700 | $19,160 | $57,540 |
| 2022 | $1,200 | $58,720 | $8,760 | $49,960 |
| 2021 | $1,200 | $55,950 | $8,760 | $47,190 |
| 2020 | $1,098 | $47,620 | $8,760 | $38,860 |
| 2019 | $1,134 | $50,580 | $8,760 | $41,820 |
| 2018 | $1,110 | $50,580 | $8,760 | $41,820 |
| 2017 | $1,036 | $50,580 | $8,760 | $41,820 |
| 2016 | $1,438 | $45,540 | $0 | $0 |
| 2015 | $998 | $49,630 | $0 | $0 |
| 2014 | $1,102 | $49,630 | $0 | $0 |
| 2013 | $1,084 | $0 | $0 | $0 |
| 2012 | -- | $49,860 | $8,260 | $41,600 |
Seller's Agent in 2012
Deb Haussmann
KW 1Advantage
(563) 343-4747
12 in this area
151 Total Sales
C
Buyer's Agent in 2012
Chris Pace
Keller Williams Greater Quad Cities / Midwest Partners
Source: RMLS Alliance
MLS Number: RMAQC4132192
APN: F0031-30
Disclaimer: Certain information contained herein is derived from information provided by parties other than Homes.com. All information provided is deemed reliable, but is not guaranteed to be accurate and should be independently verified.
![]() IDX information is provided exclusively for personal, non-commercial use, and may not be used for any purpose other than to identify prospective properties consumers may be interested in purchasing. Information is deemed reliable but not guaranteed.
IDX information is provided exclusively for personal, non-commercial use, and may not be used for any purpose other than to identify prospective properties consumers may be interested in purchasing. Information is deemed reliable but not guaranteed.