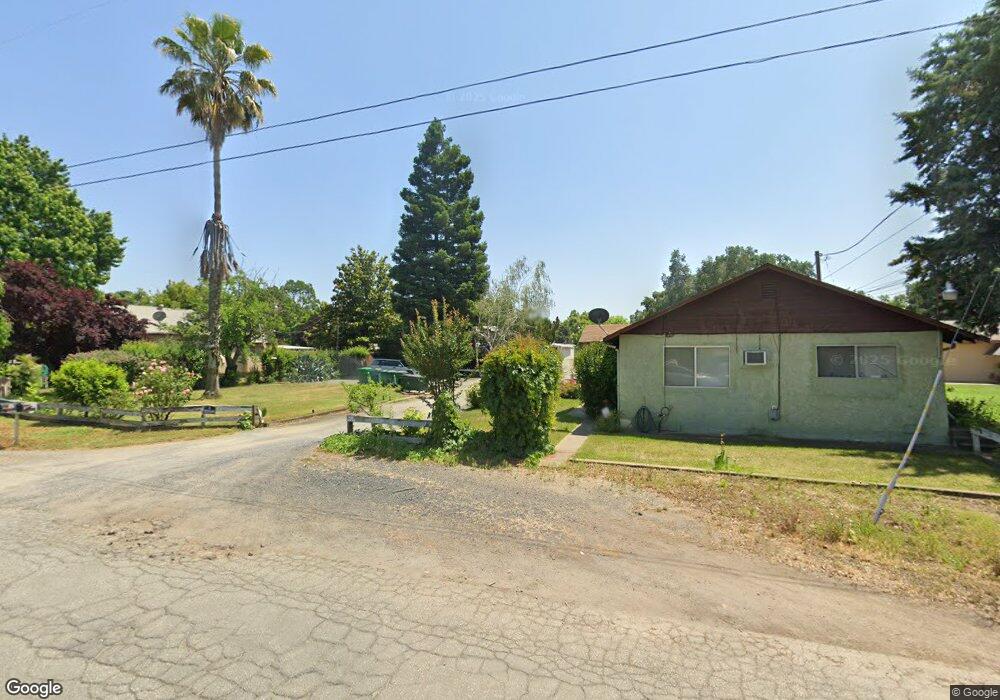
1119 Locust St Gridley, CA 95948
Estimated Value: $239,000 - $257,159
2
Beds
1
Bath
896
Sq Ft
$281/Sq Ft
Est. Value
About This Home
This home is located at 1119 Locust St, Gridley, CA 95948 and is currently estimated at $252,040, approximately $281 per square foot. 1119 Locust St is a home located in Butte County with nearby schools including McKinley Elementary School, Wilson Elementary School, and Sycamore Middle School.
Ownership History
Date
Name
Owned For
Owner Type
Purchase Details
Closed on
Mar 23, 2022
Sold by
Watson Family Trust
Bought by
Perito Moreno Holdings Llc
Current Estimated Value
Purchase Details
Closed on
Jan 3, 2014
Sold by
Watson Richard Frank and Watson Delaina Lou
Bought by
The Watson Family Trust Of 2014
Purchase Details
Closed on
Oct 2, 1997
Sold by
Flores Joseph B
Bought by
Flores Joseph Bettencourt and Flores Virginia
Create a Home Valuation Report for This Property
The Home Valuation Report is an in-depth analysis detailing your home's value as well as a comparison with similar homes in the area
Home Values in the Area
Average Home Value in this Area
Purchase History
| Date | Buyer | Sale Price | Title Company |
|---|---|---|---|
| Perito Moreno Holdings Llc | $1,050,000 | First American Title | |
| The Watson Family Trust Of 2014 | -- | None Available | |
| Flores Joseph Bettencourt | -- | -- |
Source: Public Records
Tax History
| Year | Tax Paid | Tax Assessment Tax Assessment Total Assessment is a certain percentage of the fair market value that is determined by local assessors to be the total taxable value of land and additions on the property. | Land | Improvement |
|---|---|---|---|---|
| 2025 | $2,220 | $201,628 | $106,120 | $95,508 |
| 2024 | $2,220 | $197,676 | $104,040 | $93,636 |
| 2023 | $2,208 | $193,800 | $102,000 | $91,800 |
| 2022 | $578 | $102,475 | $60,280 | $42,195 |
| 2021 | $1,129 | $100,467 | $59,099 | $41,368 |
| 2020 | $1,127 | $99,438 | $58,494 | $40,944 |
| 2019 | $1,106 | $97,490 | $57,348 | $40,142 |
| 2018 | $1,089 | $95,579 | $56,224 | $39,355 |
| 2017 | $1,068 | $93,706 | $55,122 | $38,584 |
| 2016 | $1,027 | $91,870 | $54,042 | $37,828 |
| 2015 | $1,081 | $90,491 | $53,231 | $37,260 |
| 2014 | $1,065 | $88,720 | $52,189 | $36,531 |
Source: Public Records
Map
Nearby Homes
Your Personal Tour Guide
Ask me questions while you tour the home.