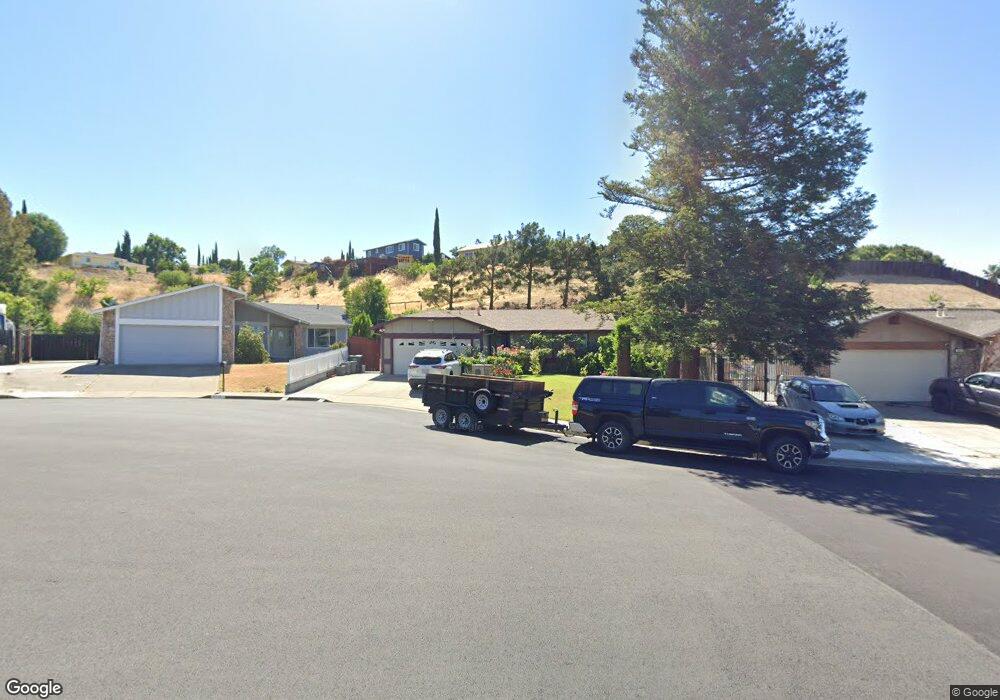
1119 Los Palos Ct Pittsburg, CA 94565
Pittsburg Southwest NeighborhoodEstimated Value: $545,000 - $621,000
3
Beds
1
Bath
992
Sq Ft
$588/Sq Ft
Est. Value
About This Home
This home is located at 1119 Los Palos Ct, Pittsburg, CA 94565 and is currently estimated at $583,572, approximately $588 per square foot. 1119 Los Palos Ct is a home located in Contra Costa County with nearby schools including Bel Air Elementary School, Riverview Middle School, and Mt. Diablo High School.
Ownership History
Date
Name
Owned For
Owner Type
Purchase Details
Closed on
Apr 21, 2000
Sold by
Garcia Silva
Bought by
Garcia Luis Carlos
Current Estimated Value
Home Financials for this Owner
Home Financials are based on the most recent Mortgage that was taken out on this home.
Original Mortgage
$178,148
Interest Rate
8.24%
Mortgage Type
FHA
Purchase Details
Closed on
Apr 20, 2000
Sold by
Lefaive Patrick H and Lefaive Becky A
Bought by
Garcia Luis Carlos
Home Financials for this Owner
Home Financials are based on the most recent Mortgage that was taken out on this home.
Original Mortgage
$178,148
Interest Rate
8.24%
Mortgage Type
FHA
Purchase Details
Closed on
Apr 12, 1994
Sold by
Micich Steve A and Micich Diane
Bought by
Lefaive Patrick H and Lefaive Becky A
Home Financials for this Owner
Home Financials are based on the most recent Mortgage that was taken out on this home.
Original Mortgage
$133,848
Interest Rate
7.67%
Mortgage Type
Assumption
Create a Home Valuation Report for This Property
The Home Valuation Report is an in-depth analysis detailing your home's value as well as a comparison with similar homes in the area
Home Values in the Area
Average Home Value in this Area
Purchase History
| Date | Buyer | Sale Price | Title Company |
|---|---|---|---|
| Garcia Luis Carlos | -- | Financial Title Company | |
| Garcia Luis Carlos | $180,500 | Financial Title Company | |
| Lefaive Patrick H | $130,000 | Fidelity National Title Ins |
Source: Public Records
Mortgage History
| Date | Status | Borrower | Loan Amount |
|---|---|---|---|
| Previous Owner | Garcia Luis Carlos | $178,148 | |
| Previous Owner | Lefaive Patrick H | $133,848 |
Source: Public Records
Tax History Compared to Growth
Tax History
| Year | Tax Paid | Tax Assessment Tax Assessment Total Assessment is a certain percentage of the fair market value that is determined by local assessors to be the total taxable value of land and additions on the property. | Land | Improvement |
|---|---|---|---|---|
| 2025 | $4,171 | $324,215 | $61,465 | $262,750 |
| 2024 | $3,928 | $317,859 | $60,260 | $257,599 |
| 2023 | $3,928 | $296,628 | $59,079 | $237,549 |
| 2022 | $3,571 | $261,401 | $57,921 | $203,480 |
| 2021 | $3,490 | $256,277 | $56,786 | $199,491 |
| 2019 | $3,403 | $248,677 | $55,102 | $193,575 |
| 2018 | $3,288 | $243,802 | $54,022 | $189,780 |
| 2017 | $3,186 | $239,022 | $52,963 | $186,059 |
| 2016 | $3,099 | $234,336 | $51,925 | $182,411 |
| 2015 | $3,069 | $230,818 | $51,146 | $179,672 |
| 2014 | $2,694 | $197,000 | $43,653 | $153,347 |
Source: Public Records
Map
Nearby Homes
- 127 Delta Vista Ln
- 751 Bailey Rd
- 383 Cleveland Ave
- 193 Maureen Cir
- 530 Michele Ct
- 1185 Brooktrail Dr
- 818 Dobrich Cir
- 2126 Mendocino Dr
- 68 - 76 Bayview Ave
- 2234 Montevideo Dr
- 79 Bella Vista Ave
- 50 Mims Ave
- 80 Mims Ave
- 1085 Oakpoint Dr
- 61 Galleon Way
- 7 Lancaster Cir Unit 235
- 8 Lancaster Cir Unit 118
- 6 Lancaster Cir Unit 214
- 6 Lancaster Cir Unit 114
- 1998 Calaveras Dr
- 1121 Los Palos Ct
- 1117 Los Palos Ct
- 2212 Chestnut Dr
- 1150 Los Palos Ct
- 2218 Chestnut Dr
- 1115 Los Palos Ct
- 2208 Chestnut Dr
- 1109 Los Palos Ct
- 1148 Los Palos Ct
- 1113 Los Palos Ct
- 2220 Chestnut Dr
- 1111 Los Palos Ct
- 1142 Los Palos Ct
- 1145 Alamo Way
- 1107 Los Palos Ct
- 1143 Alamo Way
- 1151 Alamo Way
- 1137 Alamo Way
- 1140 Los Palos Ct
- 2226 Chestnut Dr