Estimated Value: $68,000 - $101,000
3
Beds
2
Baths
1,152
Sq Ft
$75/Sq Ft
Est. Value
About This Home
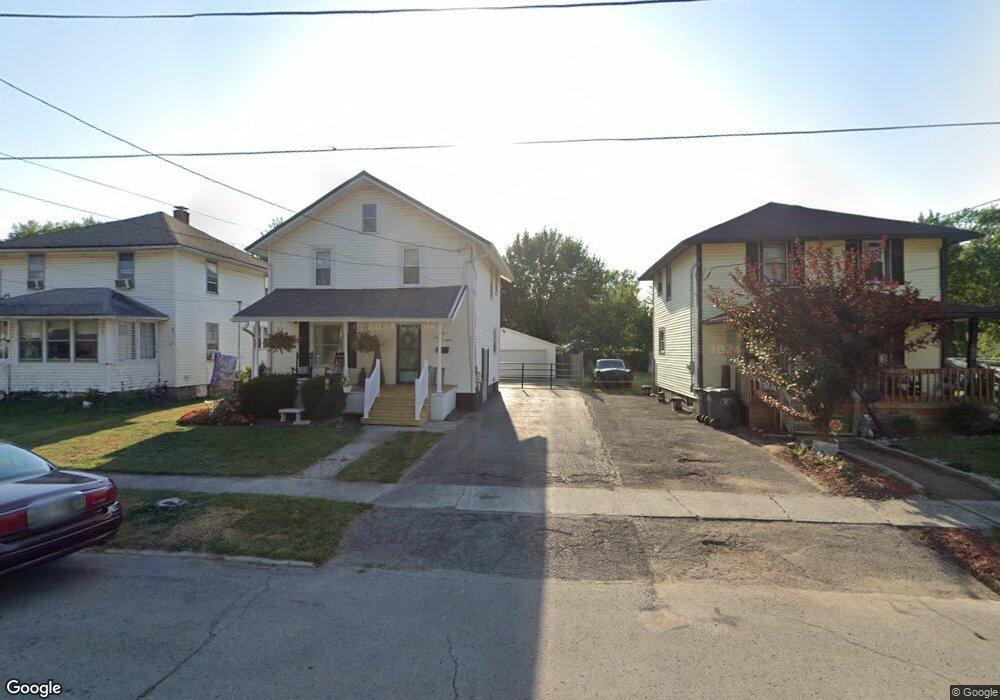
This home is located at 1119 N Central Ave, Lima, OH 45801 and is currently estimated at $86,151, approximately $74 per square foot. 1119 N Central Ave is a home located in Allen County with nearby schools including Independence Elementary School, Lima North Middle School, and Lima West Middle School.
Ownership History
Date
Name
Owned For
Owner Type
Purchase Details
Closed on
Jul 14, 2005
Sold by
Puffpaff Brian M
Bought by
Bassitt Shelly
Current Estimated Value
Home Financials for this Owner
Home Financials are based on the most recent Mortgage that was taken out on this home.
Original Mortgage
$13,700
Interest Rate
5.69%
Mortgage Type
Stand Alone Second
Purchase Details
Closed on
Dec 2, 2002
Sold by
Ripley Thomas A
Bought by
Puffpaff David T
Purchase Details
Closed on
Jun 17, 2002
Sold by
Exc Cyril J Keiffer Jr
Bought by
Ripley Brian M Puffpaff Thomas A
Home Financials for this Owner
Home Financials are based on the most recent Mortgage that was taken out on this home.
Original Mortgage
$58,537
Interest Rate
6.87%
Mortgage Type
FHA
Purchase Details
Closed on
Aug 1, 1976
Bought by
Keiffer Dorothy J
Create a Home Valuation Report for This Property
The Home Valuation Report is an in-depth analysis detailing your home's value as well as a comparison with similar homes in the area
Purchase History
| Date | Buyer | Sale Price | Title Company |
|---|---|---|---|
| Bassitt Shelly | $68,500 | None Available | |
| Puffpaff David T | $18,300 | -- | |
| Ripley Brian M Puffpaff Thomas A | $59,000 | -- | |
| Keiffer Dorothy J | $14,500 | -- |
Source: Public Records
Mortgage History
| Date | Status | Borrower | Loan Amount |
|---|---|---|---|
| Closed | Bassitt Shelly | $13,700 | |
| Previous Owner | Ripley Brian M Puffpaff Thomas A | $58,537 |
Source: Public Records
Tax History
| Year | Tax Paid | Tax Assessment Tax Assessment Total Assessment is a certain percentage of the fair market value that is determined by local assessors to be the total taxable value of land and additions on the property. | Land | Improvement |
|---|---|---|---|---|
| 2024 | $882 | $23,700 | $2,910 | $20,790 |
| 2023 | $810 | $18,660 | $2,280 | $16,380 |
| 2022 | $807 | $18,660 | $2,280 | $16,380 |
| 2021 | $854 | $18,660 | $2,280 | $16,380 |
| 2020 | $859 | $16,670 | $2,210 | $14,460 |
| 2019 | $859 | $16,670 | $2,210 | $14,460 |
| 2018 | $855 | $16,670 | $2,210 | $14,460 |
| 2017 | $862 | $16,670 | $2,210 | $14,460 |
| 2016 | $872 | $16,670 | $2,210 | $14,460 |
| 2015 | $892 | $16,670 | $2,210 | $14,460 |
| 2014 | $850 | $16,100 | $2,170 | $13,930 |
| 2013 | $828 | $16,100 | $2,170 | $13,930 |
Source: Public Records
Map
Nearby Homes
- 919 N Main St
- 922 N Jefferson St
- 1435 N Central Ave
- 735 N Elizabeth St
- 1021 N McDonel St
- 316 Ewing Ave
- 406 Ewing Ave
- 207 W Lane Ave
- 812 Christopher Dr
- 557 W Ashton Ave
- 576 W Ashton Ave
- 608 W O'Connor Ave
- 934 N Metcalf St
- 645 W O'Connor Ave
- 1212 Virginia Ave
- 635 W Ashton Ave
- 416 Hazel Ave
- 435 Marian Ave
- 1889 N Metcalf St
- 514 & 516 N Elizabeth St
- 1115 N Central Ave
- 1123 N Central Ave
- 1111 N Central Ave
- 1135 N Central Ave
- 1118 N Central Ave
- 1127 N Central Ave
- 1120 N Union St
- 0 Central N
- 1122 N Union St
- 1118 N Union St
- 287 Mullen Ave
- 267 Mullen Ave
- 267 Mullins
- 1108 N Union St
- 1132 N Union St
- 1122 N Central Ave
- 1106 N Central Ave
- 1104 N Union St
- 214 E Oconnor Ave
Your Personal Tour Guide
Ask me questions while you tour the home.