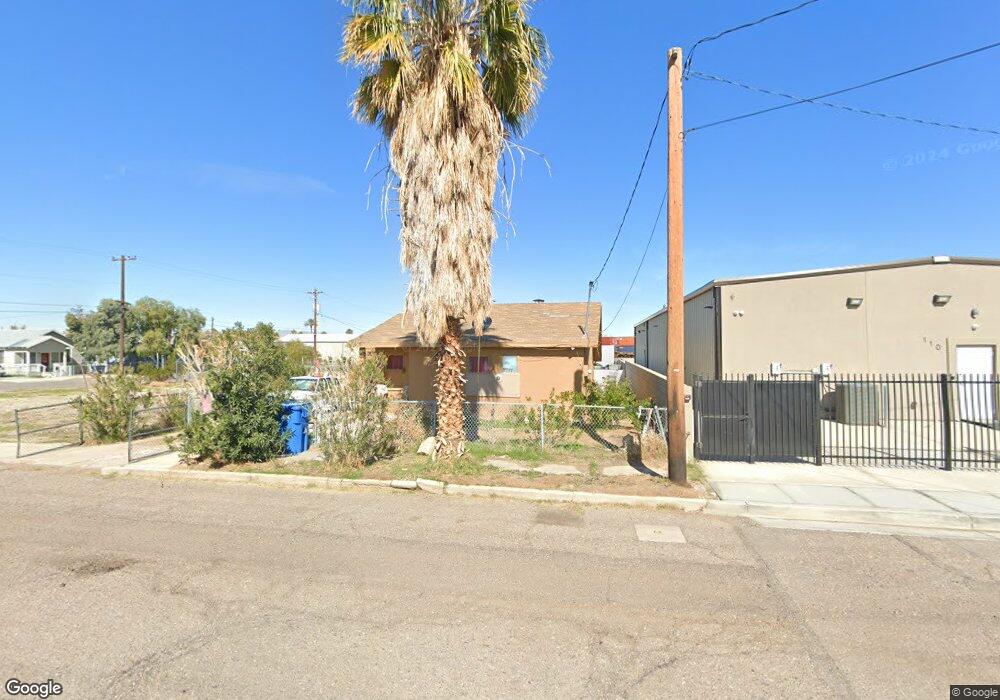
112 Cibola St Needles, CA 92363
Estimated Value: $96,112 - $179,000
2
Beds
1
Bath
973
Sq Ft
$131/Sq Ft
Est. Value
About This Home
This home is located at 112 Cibola St, Needles, CA 92363 and is currently estimated at $127,778, approximately $131 per square foot. 112 Cibola St is a home located in San Bernardino County with nearby schools including Vista Colorado Elementary School, Chemehuevi Valley Elementary School, and Needles Middle School.
Ownership History
Date
Name
Owned For
Owner Type
Purchase Details
Closed on
Apr 16, 1999
Sold by
Deshane Raymond
Bought by
Monegan Sophia R
Current Estimated Value
Purchase Details
Closed on
Nov 19, 1997
Sold by
Rogers Roy E Trust and Raymond H
Bought by
Monegan John P and Monegan Sophia R
Home Financials for this Owner
Home Financials are based on the most recent Mortgage that was taken out on this home.
Original Mortgage
$30,010
Interest Rate
7.16%
Mortgage Type
FHA
Create a Home Valuation Report for This Property
The Home Valuation Report is an in-depth analysis detailing your home's value as well as a comparison with similar homes in the area
Home Values in the Area
Average Home Value in this Area
Purchase History
| Date | Buyer | Sale Price | Title Company |
|---|---|---|---|
| Monegan Sophia R | -- | -- | |
| Monegan John P | $30,000 | First American Title Ins Co |
Source: Public Records
Mortgage History
| Date | Status | Borrower | Loan Amount |
|---|---|---|---|
| Previous Owner | Monegan John P | $30,010 |
Source: Public Records
Tax History
| Year | Tax Paid | Tax Assessment Tax Assessment Total Assessment is a certain percentage of the fair market value that is determined by local assessors to be the total taxable value of land and additions on the property. | Land | Improvement |
|---|---|---|---|---|
| 2025 | $774 | $61,727 | $5,693 | $56,034 |
| 2024 | $758 | $60,516 | $5,581 | $54,935 |
| 2023 | $834 | $59,330 | $5,472 | $53,858 |
| 2022 | $814 | $58,167 | $5,365 | $52,802 |
| 2021 | $800 | $57,027 | $5,260 | $51,767 |
| 2020 | $792 | $56,442 | $5,206 | $51,236 |
| 2019 | $795 | $55,335 | $5,104 | $50,231 |
| 2018 | $791 | $54,250 | $5,004 | $49,246 |
| 2017 | $767 | $53,186 | $4,906 | $48,280 |
| 2016 | $696 | $52,143 | $4,810 | $47,333 |
| 2015 | $583 | $51,360 | $4,738 | $46,622 |
| 2014 | $525 | $50,354 | $4,645 | $45,709 |
Source: Public Records
Map
Nearby Homes
- 110 Cibola St
- 105 W Broadway St
- 121 Cibola St
- 522 Quivera St
- 518 Quivera St
- 609 Quivera St
- 516 Quivera St
- 201 Cibola St
- 208 Cibola St
- 10 E Broadway St
- 205 Bazoobuth St
- 621 Quivera St
- 621 Quivera St
- 207 Cibola St
- 210 Cibola St
- 209 Bazoobuth St
- 610 Quivera St
- 11 E Broadway St
- 211 Cibola St
- 211 Bazoobuth St
Your Personal Tour Guide
Ask me questions while you tour the home.