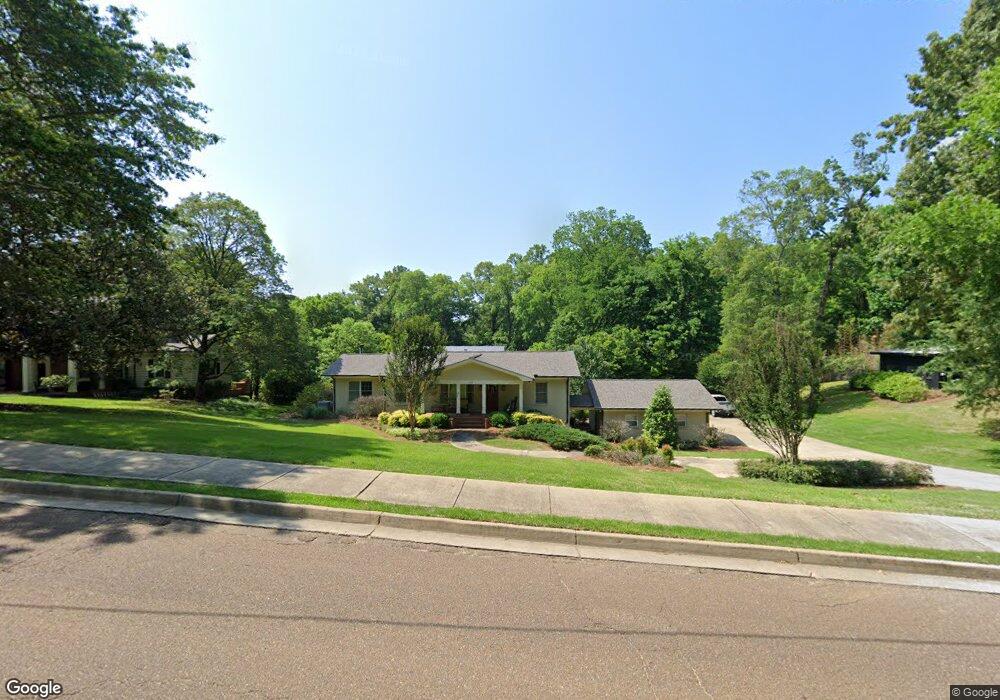
112 Douglas Dr Oxford, MS 38655
Estimated Value: $1,068,000 - $1,372,000
--
Bed
1
Bath
4,144
Sq Ft
$290/Sq Ft
Est. Value
About This Home
This home is located at 112 Douglas Dr, Oxford, MS 38655 and is currently estimated at $1,200,737, approximately $289 per square foot. 112 Douglas Dr is a home located in Lafayette County with nearby schools including Bramlett Elementary School, Central Elementary School, and Della Davidson Elementary School.
Ownership History
Date
Name
Owned For
Owner Type
Purchase Details
Closed on
Sep 12, 2023
Sold by
3D Blind Brothers Llc
Bought by
Guaranty Bank & Trust Company
Current Estimated Value
Purchase Details
Closed on
Jun 1, 2023
Sold by
Mickle Hayward Jr Kenneth
Bought by
3D Blind Brothers Llc
Purchase Details
Closed on
Mar 27, 2023
Sold by
Mickle Hayward Jr Kenneth
Bought by
Hayward Keith
Purchase Details
Closed on
Jan 24, 2013
Sold by
Kenneth Mickle Hayward Revocable Living
Bought by
Hayward William Keith and Hayward Cheryl C
Create a Home Valuation Report for This Property
The Home Valuation Report is an in-depth analysis detailing your home's value as well as a comparison with similar homes in the area
Home Values in the Area
Average Home Value in this Area
Purchase History
| Date | Buyer | Sale Price | Title Company |
|---|---|---|---|
| Guaranty Bank & Trust Company | -- | None Listed On Document | |
| 3D Blind Brothers Llc | -- | None Listed On Document | |
| Hayward Keith | -- | None Listed On Document | |
| Hayward William Keith | -- | None Available |
Source: Public Records
Tax History Compared to Growth
Tax History
| Year | Tax Paid | Tax Assessment Tax Assessment Total Assessment is a certain percentage of the fair market value that is determined by local assessors to be the total taxable value of land and additions on the property. | Land | Improvement |
|---|---|---|---|---|
| 2024 | $7,293 | $57,474 | $0 | $0 |
| 2023 | $7,293 | $56,685 | $0 | $0 |
| 2022 | $7,075 | $56,685 | $0 | $0 |
| 2021 | $1,877 | $56,396 | $0 | $0 |
| 2020 | $1,603 | $50,146 | $0 | $0 |
| 2019 | $1,603 | $50,164 | $0 | $0 |
| 2018 | $1,603 | $50,164 | $0 | $0 |
| 2017 | $1,603 | $50,164 | $0 | $0 |
| 2016 | $1,222 | $40,670 | $0 | $0 |
| 2015 | -- | $40,670 | $0 | $0 |
| 2014 | -- | $40,670 | $0 | $0 |
Source: Public Records
Map
Nearby Homes