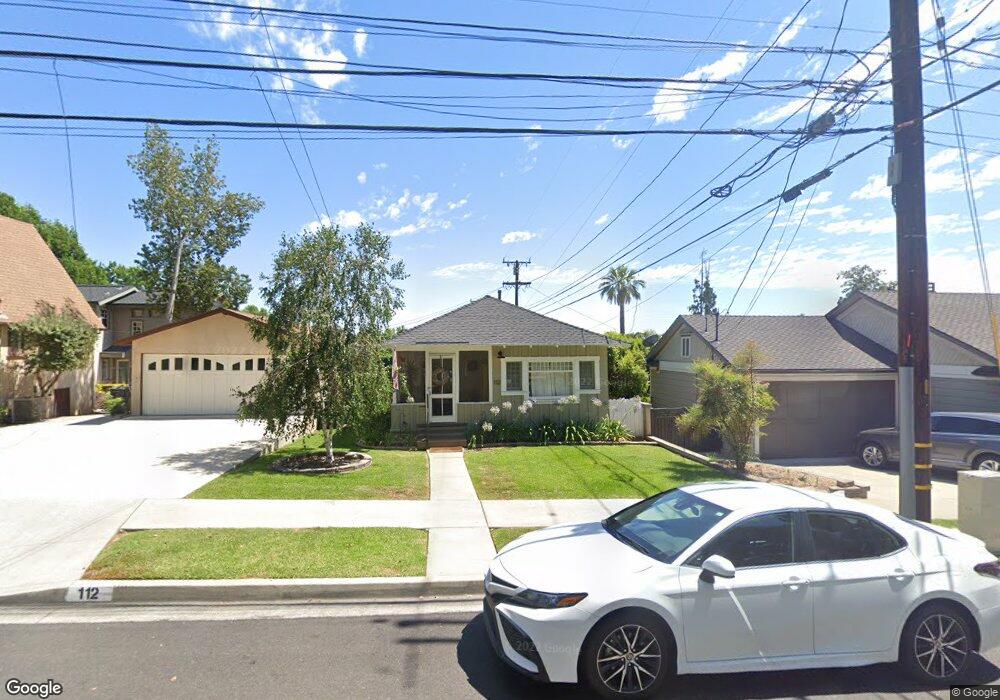
112 E Greystone Ave Monrovia, CA 91016
Estimated Value: $1,361,000 - $1,505,000
4
Beds
3
Baths
2,376
Sq Ft
$614/Sq Ft
Est. Value
About This Home
This home is located at 112 E Greystone Ave, Monrovia, CA 91016 and is currently estimated at $1,459,403, approximately $614 per square foot. 112 E Greystone Ave is a home located in Los Angeles County with nearby schools including Mayflower Elementary School, Clifton Middle School, and Monrovia High School.
Ownership History
Date
Name
Owned For
Owner Type
Purchase Details
Closed on
Oct 6, 2023
Sold by
Tipping Richard
Bought by
Richard Eugene Tipping Living Trust and Tipping
Current Estimated Value
Purchase Details
Closed on
Apr 20, 2000
Sold by
Richey Earl E and Richey Dolores L
Bought by
Richey Earl E and Richey Dolores L
Create a Home Valuation Report for This Property
The Home Valuation Report is an in-depth analysis detailing your home's value as well as a comparison with similar homes in the area
Home Values in the Area
Average Home Value in this Area
Purchase History
| Date | Buyer | Sale Price | Title Company |
|---|---|---|---|
| Richard Eugene Tipping Living Trust | -- | None Listed On Document | |
| Richey Earl E | -- | -- |
Source: Public Records
Tax History
| Year | Tax Paid | Tax Assessment Tax Assessment Total Assessment is a certain percentage of the fair market value that is determined by local assessors to be the total taxable value of land and additions on the property. | Land | Improvement |
|---|---|---|---|---|
| 2025 | $16,472 | $1,244,795 | $746,877 | $497,918 |
| 2024 | $16,472 | $1,220,388 | $732,233 | $488,155 |
| 2023 | $16,093 | $1,196,460 | $717,876 | $478,584 |
| 2022 | $15,623 | $1,173,000 | $703,800 | $469,200 |
| 2021 | $15,318 | $1,150,000 | $690,000 | $460,000 |
| 2020 | $1,469 | $62,702 | $31,799 | $30,903 |
| 2019 | $1,450 | $61,474 | $31,176 | $30,298 |
| 2018 | $1,337 | $60,269 | $30,565 | $29,704 |
| 2016 | $1,265 | $57,930 | $29,379 | $28,551 |
| 2015 | $1,242 | $57,061 | $28,938 | $28,123 |
| 2014 | $1,244 | $55,945 | $28,372 | $27,573 |
Source: Public Records
Map
Nearby Homes
- 319 N Encinitas Ave
- 250 N Primrose Ave
- 347 Stedman Place
- 179 N Ivy Ave
- 378 N Myrtle Ave
- 228 Oaks Ave
- 137 N Myrtle Ave
- 425 N Canyon Blvd
- 113 N Ivy Ave Unit 113 & 115
- 257 Aspen Dr
- 426 N Canyon Blvd
- 245 W Scenic Dr
- 376 Hill St
- 149 Grand Ave
- 328 N Alta Vista Ave
- 208 Canyon Crest Dr
- 102 Mill Run
- 267 Linwood Ave Unit E
- 248 Poppy Ave
- 402 Lotone St
- 267 N Encinitas Ave
- 263 N Encinitas Ave
- 270 N Myrtle Ave
- 270 N Myrtle Ave
- 268 N Myrtle Ave
- 259 N Encinitas Ave
- 123 E Greystone Ave
- 262 N Myrtle Ave
- 115 E Greystone Ave
- 111 E Greystone Ave
- 272 N Encinitas Ave
- 268 N Encinitas Ave
- 255 N Encinitas Ave
- 260 N Myrtle Ave
- 264 N Encinitas Ave
- 105 E Greystone Ave
- 260 N Encinitas Ave
- 101 E Greystone Ave
- 256 N Myrtle Ave
- 131 E Greystone Ave
Your Personal Tour Guide
Ask me questions while you tour the home.