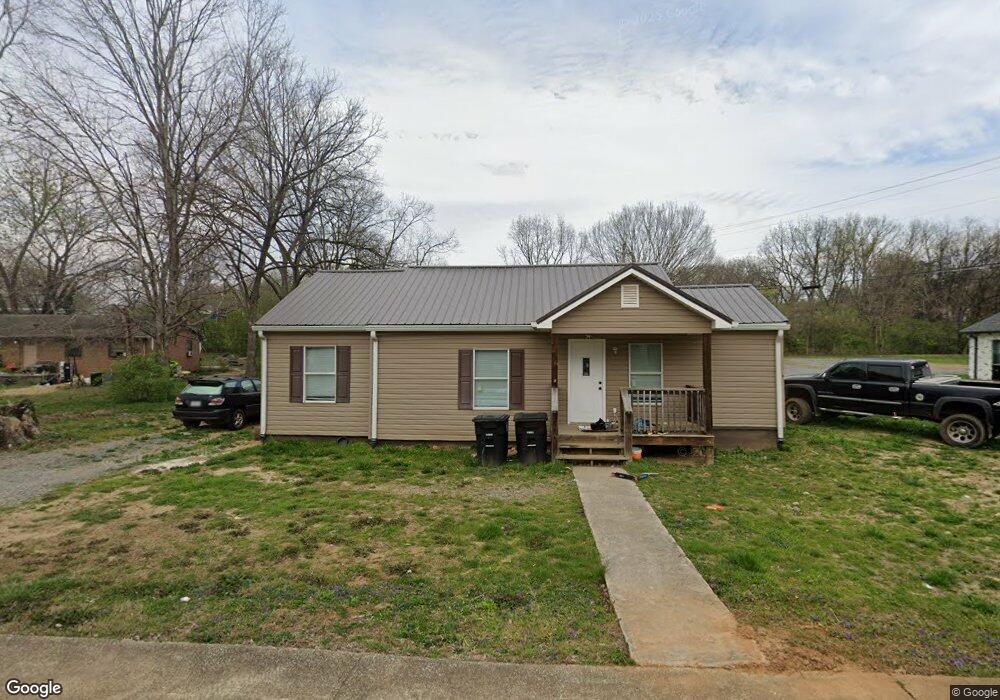
112 Fisher St Athens, TN 37303
Estimated Value: $179,046 - $226,000
--
Bed
1
Bath
854
Sq Ft
$241/Sq Ft
Est. Value
About This Home
This home is located at 112 Fisher St, Athens, TN 37303 and is currently estimated at $206,012, approximately $241 per square foot. 112 Fisher St is a home located in McMinn County with nearby schools including Ingleside Elementary School, City Park Elementary School, and North City Elementary School.
Ownership History
Date
Name
Owned For
Owner Type
Purchase Details
Closed on
Sep 20, 2022
Sold by
Omni Holdings Llc
Bought by
Omni Holdings Llc
Current Estimated Value
Home Financials for this Owner
Home Financials are based on the most recent Mortgage that was taken out on this home.
Original Mortgage
$174,750
Outstanding Balance
$167,346
Interest Rate
5.55%
Mortgage Type
Credit Line Revolving
Estimated Equity
$38,666
Purchase Details
Closed on
Oct 1, 2019
Sold by
Miller Mitchell Scott
Bought by
All Weather Storage Llc
Home Financials for this Owner
Home Financials are based on the most recent Mortgage that was taken out on this home.
Original Mortgage
$106,250
Interest Rate
3.4%
Mortgage Type
Commercial
Purchase Details
Closed on
Nov 2, 2015
Sold by
Reed Cecil L
Bought by
Miller Mitchell Scott and Moses Dave Nathaniel
Home Financials for this Owner
Home Financials are based on the most recent Mortgage that was taken out on this home.
Original Mortgage
$17,000
Interest Rate
3.89%
Mortgage Type
New Conventional
Create a Home Valuation Report for This Property
The Home Valuation Report is an in-depth analysis detailing your home's value as well as a comparison with similar homes in the area
Home Values in the Area
Average Home Value in this Area
Purchase History
| Date | Buyer | Sale Price | Title Company |
|---|---|---|---|
| Omni Holdings Llc | -- | Valley Title | |
| All Weather Storage Llc | $125,000 | -- | |
| Miller Mitchell Scott | $17,000 | -- |
Source: Public Records
Mortgage History
| Date | Status | Borrower | Loan Amount |
|---|---|---|---|
| Open | Omni Holdings Llc | $174,750 | |
| Previous Owner | All Weather Storage Llc | $106,250 | |
| Previous Owner | Miller Mitchell Scott | $17,000 |
Source: Public Records
Tax History Compared to Growth
Tax History
| Year | Tax Paid | Tax Assessment Tax Assessment Total Assessment is a certain percentage of the fair market value that is determined by local assessors to be the total taxable value of land and additions on the property. | Land | Improvement |
|---|---|---|---|---|
| 2025 | $1,026 | $49,100 | $0 | $0 |
| 2024 | $1,026 | $49,100 | $3,500 | $45,600 |
| 2023 | $1,026 | $49,100 | $3,500 | $45,600 |
| 2022 | $713 | $24,600 | $2,675 | $21,925 |
| 2021 | $713 | $24,600 | $2,675 | $21,925 |
| 2020 | $693 | $24,600 | $2,675 | $21,925 |
| 2019 | $693 | $24,600 | $2,675 | $21,925 |
| 2018 | $359 | $24,600 | $2,675 | $21,925 |
| 2017 | $306 | $10,275 | $2,750 | $7,525 |
| 2016 | $306 | $10,275 | $2,750 | $7,525 |
| 2015 | -- | $10,275 | $2,750 | $7,525 |
| 2014 | $282 | $10,270 | $0 | $0 |
Source: Public Records
Map
Nearby Homes
- 1618 Hogan St
- 9 Sharp Rd
- 109 Astrid St
- 286 Highway 39 W
- 518 Anton St
- 361 Tennessee Ave Unit 307
- 536 Tellico Ave
- 115 Gay St
- 112 Peach St Unit st
- 400 Warren St
- 306 Warren St
- 1502 Richardson St
- 147 Oak St
- 141 Oak St
- 153 Oak St
- 829 Northside Dr
- 708 Tennessee Ave
- 1202 Georgia Ave
- 1430 Hammerhill Rd
- 00 Tellico Ave