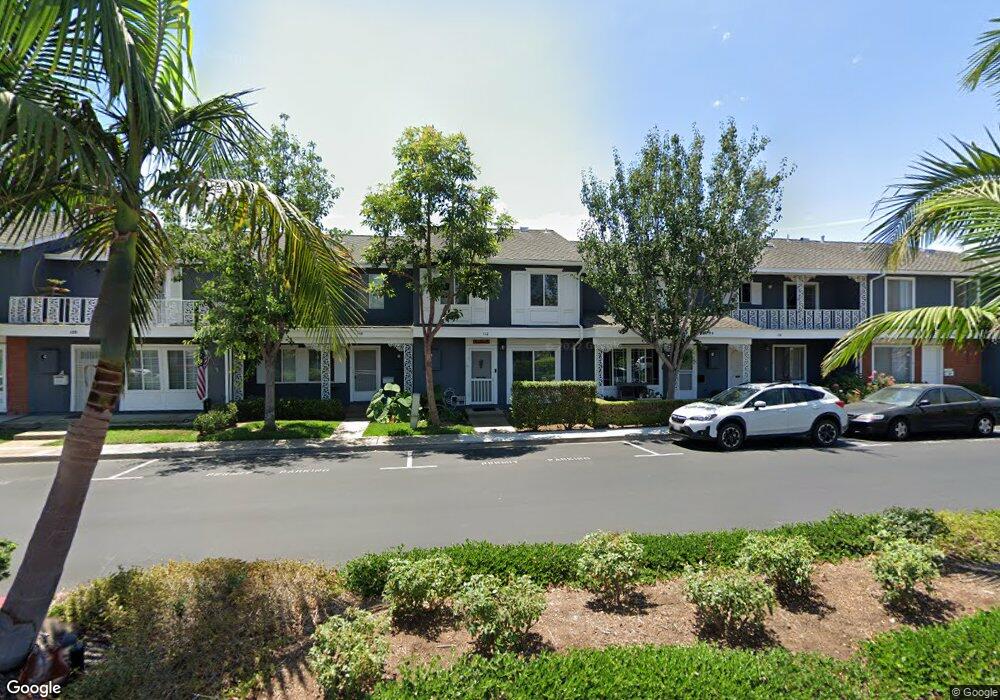
112 Lexington Ln Costa Mesa, CA 92626
Estimated Value: $842,000 - $1,005,000
3
Beds
2
Baths
1,320
Sq Ft
$686/Sq Ft
Est. Value
About This Home
This home is located at 112 Lexington Ln, Costa Mesa, CA 92626 and is currently estimated at $905,283, approximately $685 per square foot. 112 Lexington Ln is a home located in Orange County with nearby schools including College Park Elementary School, Costa Mesa High School, and Newport Beach International Montessori Academies.
Ownership History
Date
Name
Owned For
Owner Type
Purchase Details
Closed on
Jul 24, 2002
Sold by
Quick Bradley V
Bought by
Quick Bradley and Quick Karyn
Current Estimated Value
Home Financials for this Owner
Home Financials are based on the most recent Mortgage that was taken out on this home.
Original Mortgage
$70,000
Interest Rate
6.51%
Purchase Details
Closed on
Jan 12, 1995
Sold by
Patterson Floyd
Bought by
Patterson Mary and Rossi Mary
Home Financials for this Owner
Home Financials are based on the most recent Mortgage that was taken out on this home.
Original Mortgage
$63,500
Interest Rate
9.28%
Purchase Details
Closed on
Dec 23, 1994
Sold by
Rossi Mary and Rossi Susan Jean
Bought by
Quick Bradley
Home Financials for this Owner
Home Financials are based on the most recent Mortgage that was taken out on this home.
Original Mortgage
$63,500
Interest Rate
9.28%
Create a Home Valuation Report for This Property
The Home Valuation Report is an in-depth analysis detailing your home's value as well as a comparison with similar homes in the area
Purchase History
| Date | Buyer | Sale Price | Title Company |
|---|---|---|---|
| Quick Bradley | -- | Stewart Title | |
| Patterson Mary | -- | Continental Lawyers Title Co | |
| Quick Bradley | $127,000 | Continental Lawyers Title Co |
Source: Public Records
Mortgage History
| Date | Status | Borrower | Loan Amount |
|---|---|---|---|
| Closed | Quick Bradley | $70,000 | |
| Closed | Quick Bradley | $63,500 |
Source: Public Records
Tax History
| Year | Tax Paid | Tax Assessment Tax Assessment Total Assessment is a certain percentage of the fair market value that is determined by local assessors to be the total taxable value of land and additions on the property. | Land | Improvement |
|---|---|---|---|---|
| 2025 | $2,966 | $213,304 | $121,081 | $92,223 |
| 2024 | $2,966 | $209,122 | $118,707 | $90,415 |
| 2023 | $2,862 | $205,022 | $116,379 | $88,643 |
| 2022 | $2,782 | $201,002 | $114,097 | $86,905 |
| 2021 | $5,005 | $197,061 | $111,860 | $85,201 |
| 2020 | $4,920 | $195,041 | $110,713 | $84,328 |
| 2019 | $4,861 | $191,217 | $108,542 | $82,675 |
| 2018 | $4,803 | $187,468 | $106,414 | $81,054 |
| 2017 | $4,743 | $183,793 | $104,328 | $79,465 |
| 2016 | $2,470 | $180,190 | $102,283 | $77,907 |
| 2015 | $2,445 | $177,484 | $100,747 | $76,737 |
| 2014 | $2,392 | $174,008 | $98,774 | $75,234 |
Source: Public Records
Map
Nearby Homes
- 2330 Vanguard Way Unit F102
- 2330 Vanguard Way Unit L101
- 106 Lexington Ln
- 107 Yorktown Ln
- 2408 Minuteman Way
- 157 Yorktown Ln
- 2408 Saratoga Way
- 2338 Bunker Hill Way
- 115 Morristown Ln
- 135 Morristown Ln
- 2404 Niagara Way
- 2273 Columbia Dr
- 2400 Elden Ave Unit 12
- 2400 Elden Ave Unit 32
- 2528 Alder Ln
- 2234 Avalon St
- 168 Monte Vista Ave
- 2333 Rutgers Dr
- 250 Bucknell Rd
- 2279 Rutgers Dr
- 110 Lexington Ln
- 114 Lexington Ln
- 108 Lexington Ln
- 116 Lexington Ln
- 118 Lexington Ln
- 104 Lexington Ln
- 120 Lexington Ln
- 113 Lexington Ln
- 115 Lexington Ln
- 111 Lexington Ln
- 117 Lexington Ln Unit 1 Room for Rent
- 117 Lexington Ln
- 109 Lexington Ln
- 119 Lexington Ln
- 107 Lexington Ln
- 121 Lexington Ln
- 105 Lexington Ln
- 130 Lexington Ln
- 113 Yorktown Ln
- 111 Yorktown Ln
Your Personal Tour Guide
Ask me questions while you tour the home.