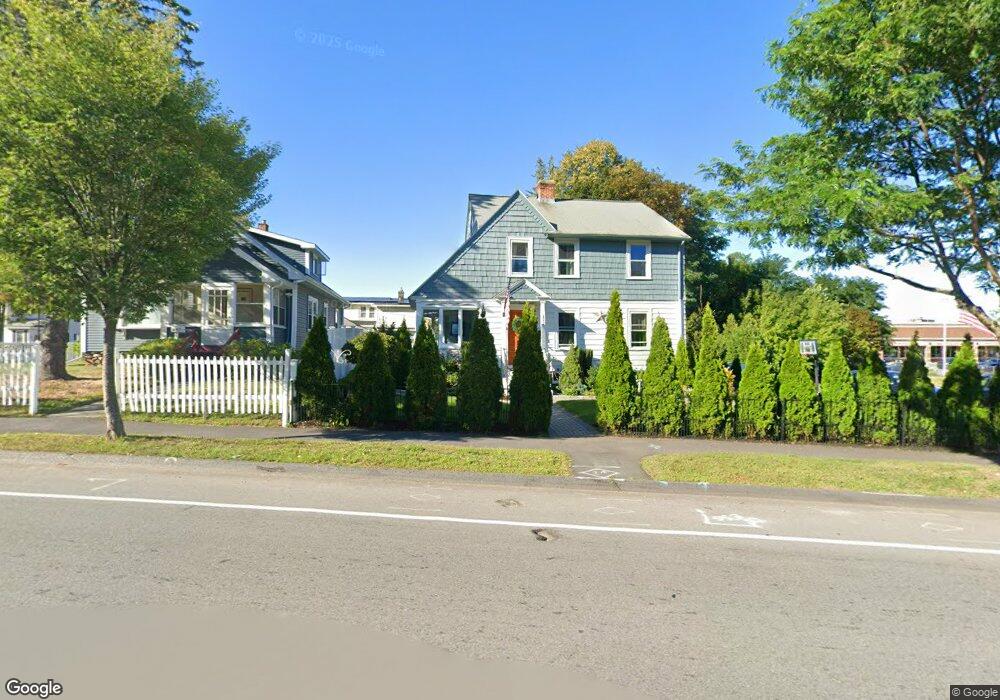
112 May St Worcester, MA 01602
Columbus Park NeighborhoodEstimated Value: $432,000 - $457,000
3
Beds
2
Baths
1,512
Sq Ft
$295/Sq Ft
Est. Value
About This Home
This home is located at 112 May St, Worcester, MA 01602 and is currently estimated at $446,647, approximately $295 per square foot. 112 May St is a home located in Worcester County with nearby schools including Jacob Hiatt Magnet School, Chandler Magnet, and May Street Elementary School.
Ownership History
Date
Name
Owned For
Owner Type
Purchase Details
Closed on
Jan 23, 2026
Sold by
Ford Soledad J
Bought by
Ford Soledad J and Ford Stephen
Current Estimated Value
Home Financials for this Owner
Home Financials are based on the most recent Mortgage that was taken out on this home.
Original Mortgage
$340,000
Outstanding Balance
$340,000
Interest Rate
6.21%
Mortgage Type
New Conventional
Estimated Equity
$106,647
Purchase Details
Closed on
Jul 17, 2018
Sold by
Okeefe May Street Rt and Rice
Bought by
Soledad-Jordan Santamaria
Home Financials for this Owner
Home Financials are based on the most recent Mortgage that was taken out on this home.
Original Mortgage
$233,000
Interest Rate
4.5%
Mortgage Type
New Conventional
Purchase Details
Closed on
Jul 16, 2018
Sold by
Gale Isabella Est and Holch
Bought by
Rice Rachel A and Hankins Thomas
Home Financials for this Owner
Home Financials are based on the most recent Mortgage that was taken out on this home.
Original Mortgage
$233,000
Interest Rate
4.5%
Mortgage Type
New Conventional
Create a Home Valuation Report for This Property
The Home Valuation Report is an in-depth analysis detailing your home's value as well as a comparison with similar homes in the area
Home Values in the Area
Average Home Value in this Area
Purchase History
| Date | Buyer | Sale Price | Title Company |
|---|---|---|---|
| Ford Soledad J | -- | -- | |
| Soledad-Jordan Santamaria | $280,000 | -- | |
| Rice Rachel A | -- | -- |
Source: Public Records
Mortgage History
| Date | Status | Borrower | Loan Amount |
|---|---|---|---|
| Open | Ford Soledad J | $340,000 | |
| Previous Owner | Soledad-Jordan Santamaria | $233,000 |
Source: Public Records
Tax History
| Year | Tax Paid | Tax Assessment Tax Assessment Total Assessment is a certain percentage of the fair market value that is determined by local assessors to be the total taxable value of land and additions on the property. | Land | Improvement |
|---|---|---|---|---|
| 2025 | $5,057 | $383,400 | $97,700 | $285,700 |
| 2024 | $4,943 | $359,500 | $97,700 | $261,800 |
| 2023 | $4,758 | $331,800 | $84,900 | $246,900 |
| 2022 | $4,402 | $289,400 | $67,900 | $221,500 |
| 2021 | $4,190 | $257,400 | $54,300 | $203,100 |
| 2020 | $4,049 | $238,200 | $54,000 | $184,200 |
| 2019 | $2,939 | $163,300 | $47,100 | $116,200 |
| 2018 | $2,927 | $154,800 | $47,100 | $107,700 |
| 2017 | $2,825 | $147,000 | $47,100 | $99,900 |
| 2016 | $2,739 | $132,900 | $33,300 | $99,600 |
| 2015 | $2,667 | $132,900 | $33,300 | $99,600 |
| 2014 | $2,597 | $132,900 | $33,300 | $99,600 |
Source: Public Records
Map
Nearby Homes
Your Personal Tour Guide
Ask me questions while you tour the home.