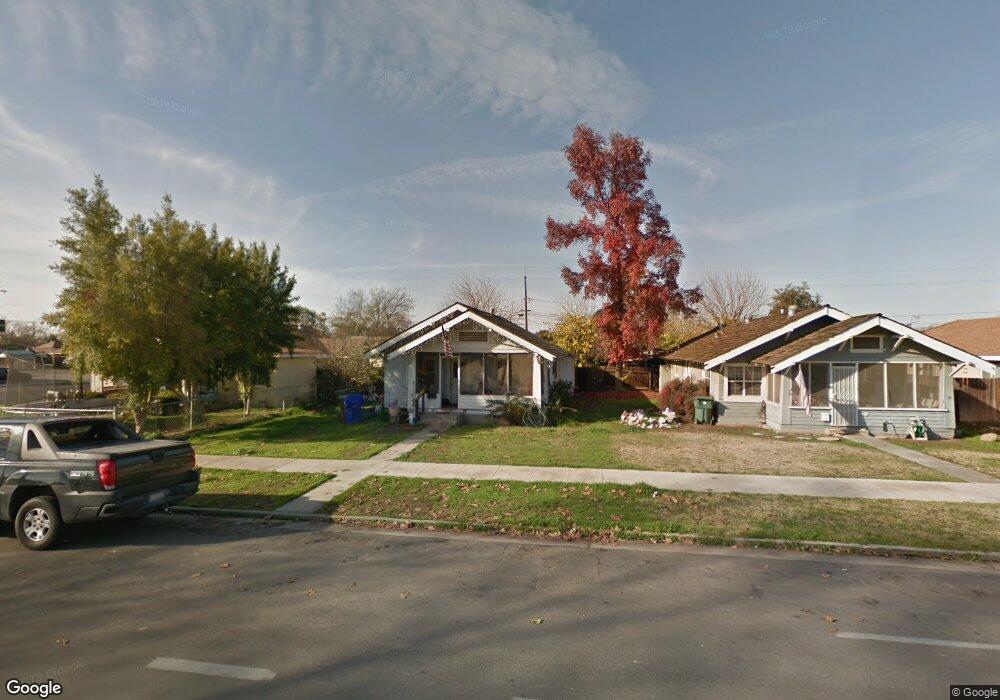
112 N Filbert Rd Exeter, CA 93221
Estimated Value: $253,942 - $300,000
3
Beds
2
Baths
1,104
Sq Ft
$246/Sq Ft
Est. Value
About This Home
This home is located at 112 N Filbert Rd, Exeter, CA 93221 and is currently estimated at $271,236, approximately $245 per square foot. 112 N Filbert Rd is a home located in Tulare County with nearby schools including Sierra View Junior Academy.
Ownership History
Date
Name
Owned For
Owner Type
Purchase Details
Closed on
Jun 28, 2016
Sold by
Evans Bruce L and Evans Cynthia R
Bought by
The Bruce & Cynthia Evans Trust
Current Estimated Value
Purchase Details
Closed on
Oct 18, 2007
Sold by
Evans Edward Donald and Evans Brenda Kay
Bought by
Evans Edward Donald and Evans Brenda Kay
Purchase Details
Closed on
Sep 25, 2003
Sold by
Zeismer Arthur and Zeismer Beulah M
Bought by
Evans Edward D and Evans Brenda K
Home Financials for this Owner
Home Financials are based on the most recent Mortgage that was taken out on this home.
Original Mortgage
$55,000
Outstanding Balance
$25,190
Interest Rate
5.94%
Mortgage Type
Seller Take Back
Estimated Equity
$246,046
Purchase Details
Closed on
Apr 25, 1994
Sold by
Zeismer Arthur
Bought by
Zeismer Arthur and Zeismer Beulah M
Purchase Details
Closed on
Jan 13, 1994
Sold by
Zeismer Arthur
Bought by
Zeismer Arthur and Zeismer Beulah M
Create a Home Valuation Report for This Property
The Home Valuation Report is an in-depth analysis detailing your home's value as well as a comparison with similar homes in the area
Home Values in the Area
Average Home Value in this Area
Purchase History
| Date | Buyer | Sale Price | Title Company |
|---|---|---|---|
| The Bruce & Cynthia Evans Trust | -- | None Available | |
| Evans Edward Donald | -- | None Available | |
| Evans Edward D | $55,000 | Fidelity National Title Co | |
| Zeismer Arthur | -- | First American Title Co | |
| Zeismer Arthur | -- | -- |
Source: Public Records
Mortgage History
| Date | Status | Borrower | Loan Amount |
|---|---|---|---|
| Open | Evans Edward D | $55,000 |
Source: Public Records
Tax History
| Year | Tax Paid | Tax Assessment Tax Assessment Total Assessment is a certain percentage of the fair market value that is determined by local assessors to be the total taxable value of land and additions on the property. | Land | Improvement |
|---|---|---|---|---|
| 2025 | $865 | $78,196 | $42,652 | $35,544 |
| 2024 | $865 | $76,664 | $41,816 | $34,848 |
| 2023 | $842 | $75,162 | $40,997 | $34,165 |
| 2022 | $825 | $73,690 | $40,194 | $33,496 |
| 2021 | $819 | $72,245 | $39,406 | $32,839 |
| 2020 | $803 | $71,504 | $39,002 | $32,502 |
| 2019 | $786 | $70,102 | $38,237 | $31,865 |
| 2018 | $744 | $68,727 | $37,487 | $31,240 |
| 2017 | $743 | $67,379 | $36,752 | $30,627 |
| 2016 | $708 | $66,057 | $36,031 | $30,026 |
| 2015 | $725 | $65,065 | $35,490 | $29,575 |
| 2014 | $701 | $63,791 | $34,795 | $28,996 |
Source: Public Records
Map
Nearby Homes
- 137 N H St
- 457 W Maple St
- 447 W Maple St
- 107 Ruth St
- 307 N Orange Ave
- 264 S Orange Ave
- 570 Little Ln
- 314 N Albert Ave Unit 132
- 314 N Albert Ave Unit 39
- 314 N Albert Ave Unit 1
- 314 N Albert Ave Unit 42
- 314 N Albert Ave Unit 73
- 314 N Albert Ave Unit 101
- 314 N Albert Ave Unit 80
- Ave 276 Avenue 276
- 200 S D St
- 509 S Orange Ave
- 606 N Orange Ave
- 812 Woods Place
- 200 N B St
- 118 N Filbert Rd
- 401 W Pine St
- 421 W Pine St
- 124 N Filbert Rd
- 429 W Pine St
- 136 N Filbert Rd
- 119 N Quince Ave
- 435 W Pine St
- 400 W Pine St
- 142 N Filbert Rd
- 125 N Quince Ave
- 156 S Filbert Rd
- 148 N Filbert Rd
- 133 N Quince Ave
- 447 W Pine St
- 141 N Quince Ave
- 300 W Pine St
- 154 N Filbert Rd
- 112 S H St
- 147 N Quince Ave
Your Personal Tour Guide
Ask me questions while you tour the home.