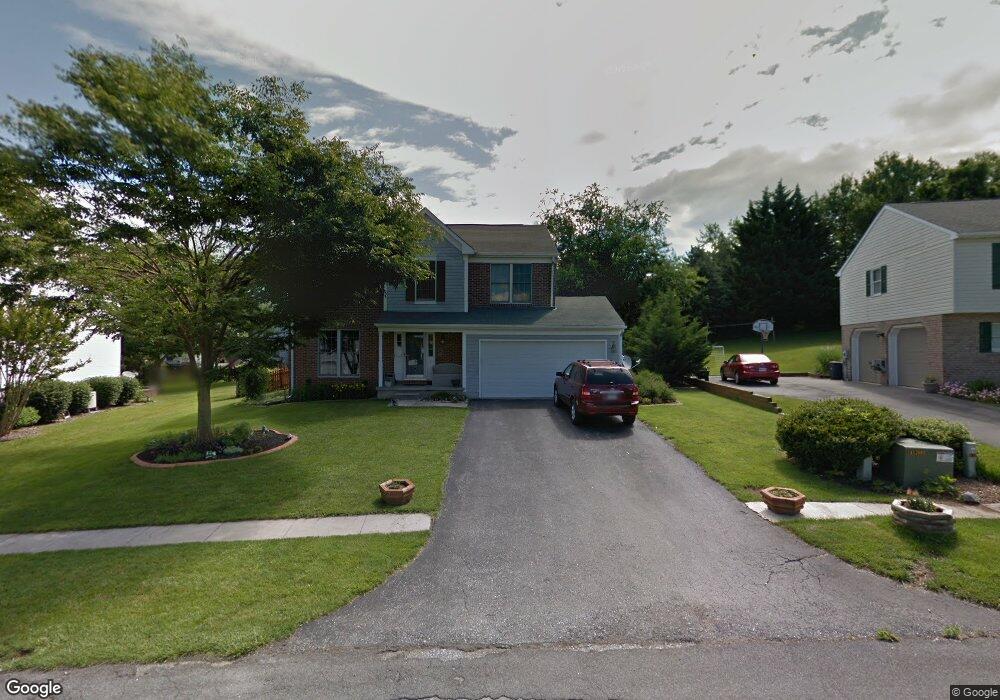
112 Rachels Ct Smithsburg, MD 21783
Estimated Value: $395,000 - $507,000
4
Beds
3
Baths
2,139
Sq Ft
$204/Sq Ft
Est. Value
About This Home
This home is located at 112 Rachels Ct, Smithsburg, MD 21783 and is currently estimated at $435,612, approximately $203 per square foot. 112 Rachels Ct is a home located in Washington County with nearby schools including Smithsburg Elementary School, Smithsburg Middle School, and Smithsburg High School.
Ownership History
Date
Name
Owned For
Owner Type
Purchase Details
Closed on
Aug 12, 2021
Sold by
Winchester Elanor J
Bought by
Jackson Martin A and Jackson Gloria J
Current Estimated Value
Home Financials for this Owner
Home Financials are based on the most recent Mortgage that was taken out on this home.
Original Mortgage
$323,040
Outstanding Balance
$293,743
Interest Rate
2.9%
Mortgage Type
FHA
Estimated Equity
$141,869
Purchase Details
Closed on
Dec 28, 2005
Sold by
Henderson Christopher P
Bought by
Winchester Elanor J
Home Financials for this Owner
Home Financials are based on the most recent Mortgage that was taken out on this home.
Original Mortgage
$341,850
Interest Rate
6.36%
Mortgage Type
VA
Purchase Details
Closed on
Nov 15, 2001
Sold by
Cunningham James F and Cunningham Wendy S
Bought by
Henderson Christopher P
Purchase Details
Closed on
Oct 20, 1989
Sold by
Mcclure Charles R
Bought by
Cunningham James F and Cunningham Wendy S
Home Financials for this Owner
Home Financials are based on the most recent Mortgage that was taken out on this home.
Original Mortgage
$110,000
Interest Rate
9.92%
Create a Home Valuation Report for This Property
The Home Valuation Report is an in-depth analysis detailing your home's value as well as a comparison with similar homes in the area
Home Values in the Area
Average Home Value in this Area
Purchase History
| Date | Buyer | Sale Price | Title Company |
|---|---|---|---|
| Jackson Martin A | $329,000 | Sterling Stlmt Svcs Of Hager | |
| Winchester Elanor J | $365,000 | -- | |
| Henderson Christopher P | $188,000 | -- | |
| Cunningham James F | $158,500 | -- |
Source: Public Records
Mortgage History
| Date | Status | Borrower | Loan Amount |
|---|---|---|---|
| Open | Jackson Martin A | $323,040 | |
| Previous Owner | Winchester Elanor J | $341,850 | |
| Previous Owner | Cunningham James F | $110,000 | |
| Closed | Henderson Christopher P | -- |
Source: Public Records
Tax History
| Year | Tax Paid | Tax Assessment Tax Assessment Total Assessment is a certain percentage of the fair market value that is determined by local assessors to be the total taxable value of land and additions on the property. | Land | Improvement |
|---|---|---|---|---|
| 2025 | $2,911 | $358,167 | $0 | $0 |
| 2024 | $2,911 | $319,500 | $65,400 | $254,100 |
| 2023 | $2,814 | $308,900 | $0 | $0 |
| 2022 | $2,717 | $298,300 | $0 | $0 |
| 2021 | $2,690 | $287,700 | $65,400 | $222,300 |
| 2020 | $2,540 | $279,667 | $0 | $0 |
| 2019 | $2,540 | $271,633 | $0 | $0 |
| 2018 | $3,001 | $263,600 | $55,400 | $208,200 |
| 2017 | $2,166 | $247,633 | $0 | $0 |
| 2016 | -- | $231,667 | $0 | $0 |
| 2015 | -- | $215,700 | $0 | $0 |
| 2014 | $2,202 | $215,700 | $0 | $0 |
Source: Public Records
Map
Nearby Homes
- 111 Vodys Ct
- 104 Rebeccas Ct
- 29 N Main St
- 102 Jasons Ridge
- 123 Jasons Ridge
- 0 E Water St Unit MDWA2027842
- 4 Shifflett Place
- 13 W Douglas Ct
- 121 Colton Ct
- 72 S Main St
- 64 Stanley Hauver Dr
- 61A E Water St
- 22538 Old Georgetown Rd
- 12829 Bradbury Ave
- 12103 Itnyre Rd
- 11736 Mapleville Rd
- 23133 Foxville Rd
- 12015 Appalachian Ct
- 22054 Mohawk Dr
- 23453 Fruit Tree Dr
- 110 Rachels Ct
- 114 Rachels Ct
- 105 Patricks Ct
- 116 Rachels Ct
- 107 Patricks Ct
- 109 Rachels Ct
- 103 Patricks Ct
- 111 Rachels Ct
- 108 Rachels Ct
- 109 Patricks Ct
- 118 Rachels Ct
- 106 Rachels Ct
- 101 Patricks Ct
- 113 Rachels Ct
- 107 Rachels Ct
- 111 Patricks Ct
- 120 Rachels Ct
- 104 Rachels Ct
- 115 Rachels Ct
- 100 Ambers Way
Your Personal Tour Guide
Ask me questions while you tour the home.