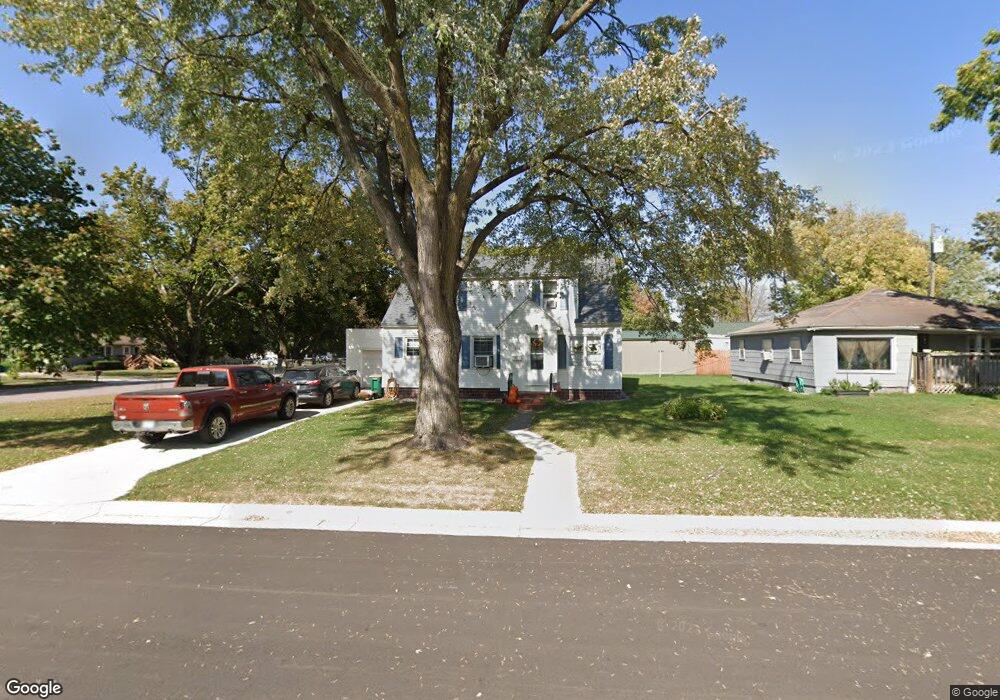
112 W 4th St Sherburn, MN 56171
Estimated Value: $83,000 - $112,000
5
Beds
1
Bath
1,530
Sq Ft
$62/Sq Ft
Est. Value
About This Home
This home is located at 112 W 4th St, Sherburn, MN 56171 and is currently estimated at $95,591, approximately $62 per square foot. 112 W 4th St is a home located in Martin County with nearby schools including Sherburn Elementary School, Trimont Elementary School, and Welcome Elementary School.
Ownership History
Date
Name
Owned For
Owner Type
Purchase Details
Closed on
Dec 9, 2020
Sold by
Finke Paula and Finke Michael
Bought by
Skrove Arik J
Current Estimated Value
Home Financials for this Owner
Home Financials are based on the most recent Mortgage that was taken out on this home.
Original Mortgage
$57,000
Outstanding Balance
$50,677
Interest Rate
2.67%
Mortgage Type
New Conventional
Estimated Equity
$44,914
Purchase Details
Closed on
Dec 8, 2020
Sold by
Finke Paula and Finke Michael
Bought by
Lutterman Loren and Lutterman Vicki
Home Financials for this Owner
Home Financials are based on the most recent Mortgage that was taken out on this home.
Original Mortgage
$57,000
Outstanding Balance
$50,677
Interest Rate
2.67%
Mortgage Type
New Conventional
Estimated Equity
$44,914
Purchase Details
Closed on
Nov 18, 2005
Sold by
Lutterman Leon Dale and Lutterman Ruth E
Bought by
Lutterman Ruth E
Create a Home Valuation Report for This Property
The Home Valuation Report is an in-depth analysis detailing your home's value as well as a comparison with similar homes in the area
Home Values in the Area
Average Home Value in this Area
Purchase History
| Date | Buyer | Sale Price | Title Company |
|---|---|---|---|
| Skrove Arik J | $69,900 | Jenkinson Abstract | |
| Lutterman Loren | $69,900 | Jenkinson Abstract Company | |
| Lutterman Ruth E | -- | None Available | |
| Skrove Arik Arik | $69,900 | -- |
Source: Public Records
Mortgage History
| Date | Status | Borrower | Loan Amount |
|---|---|---|---|
| Open | Lutterman Loren | $57,000 | |
| Closed | Skrove Arik J | $57,000 | |
| Closed | Skrove Arik J | $67,567 | |
| Closed | Lutterman Loren | $67,567 | |
| Closed | Skrove Arik Arik | $69,900 |
Source: Public Records
Tax History Compared to Growth
Tax History
| Year | Tax Paid | Tax Assessment Tax Assessment Total Assessment is a certain percentage of the fair market value that is determined by local assessors to be the total taxable value of land and additions on the property. | Land | Improvement |
|---|---|---|---|---|
| 2025 | $2,080 | $91,300 | $6,300 | $85,000 |
| 2024 | $1,690 | $92,400 | $3,600 | $88,800 |
| 2023 | $958 | $77,500 | $2,100 | $75,400 |
| 2022 | $798 | $78,200 | $2,100 | $76,100 |
| 2021 | $902 | $53,200 | $2,100 | $51,100 |
| 2020 | $1,494 | $60,800 | $2,100 | $58,700 |
| 2019 | $1,486 | $51,000 | $2,100 | $48,900 |
| 2018 | $1,498 | $47,200 | $2,100 | $45,100 |
| 2017 | $1,496 | $27,100 | $961 | $26,139 |
| 2016 | $1,544 | $27,100 | $961 | $26,139 |
| 2015 | $810 | $29,200 | $961 | $28,239 |
| 2013 | $978 | $33,000 | $1,560 | $31,440 |
Source: Public Records
Map
Nearby Homes
- 409 N Prairie St
- 102 Ringer Dr
- 211 N Prairie St
- 109 N Main St
- 306 W 2nd St
- 302 N Manyaska St
- 402 W 1st St Unit 420 1st Street West
- 402 W 1st St
- 407 E 2nd St
- 129 S Main St
- 219 Fairmont Ave
- 307 S Main St
- 725 110th St
- 602 Kenzie St
- 110th Street
- TBD Lake Shore Dr
- Xxx Lake Shore Dr
- 801 140th St
- 4 S Fox Lake Dr W
- 4 S Fox Lake Dr E
- 108 W 4th St
- 402 N Prairie St
- 310 N Prairie St
- 406 N Prairie St
- 401 N Prairie St
- 401 N Osborne St
- 315 N Prairie St
- 405 N Prairie St
- 405 N Osborne St
- 308 N Prairie St
- 410 N Prairie St
- 409 409 N Prairie St
- 309 N Osborne St
- 311 N Prairie St
- 304 N Prairie St
- 103 5th St
- 411 N Prairie St
- 305 N Osborne St
- 413 413 N Prairie St
- 307 N Prairie St