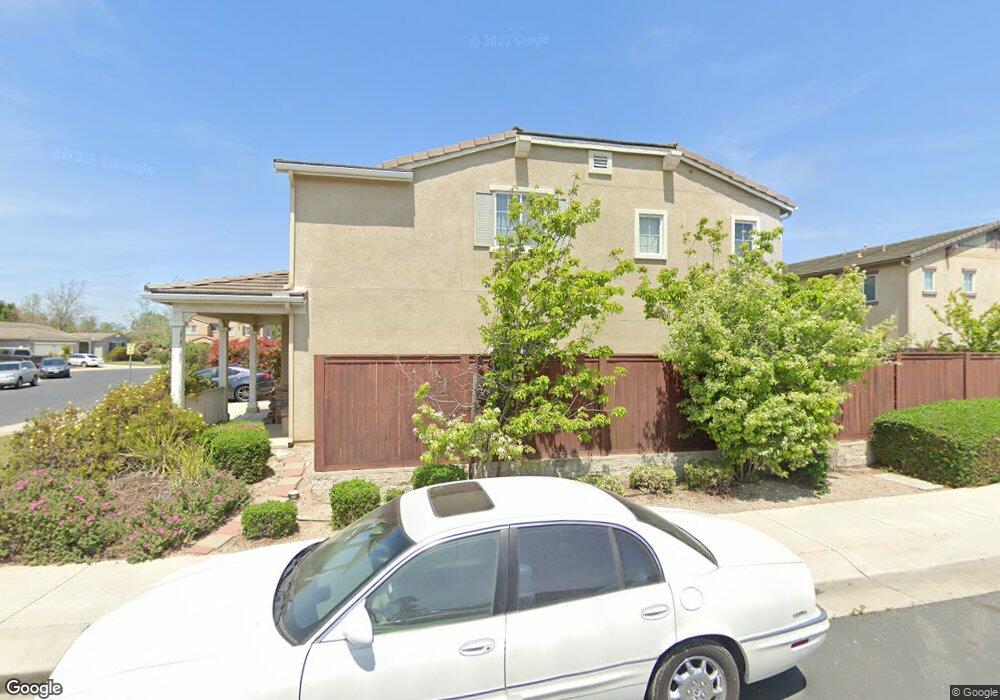
1120 Arguello Ct Lompoc, CA 93436
Estimated Value: $676,362 - $743,000
3
Beds
3
Baths
2,386
Sq Ft
$298/Sq Ft
Est. Value
About This Home
This home is located at 1120 Arguello Ct, Lompoc, CA 93436 and is currently estimated at $710,341, approximately $297 per square foot. 1120 Arguello Ct is a home located in Santa Barbara County with nearby schools including Clarence Ruth Elementary School, Lompoc Valley Middle School, and Lompoc High School.
Ownership History
Date
Name
Owned For
Owner Type
Purchase Details
Closed on
Sep 24, 2014
Sold by
Chavez Frank R and Chavez Teresa C
Bought by
Posey Simon C and Posey Jennifer L
Current Estimated Value
Home Financials for this Owner
Home Financials are based on the most recent Mortgage that was taken out on this home.
Original Mortgage
$350,374
Outstanding Balance
$267,638
Interest Rate
4.08%
Mortgage Type
VA
Estimated Equity
$442,703
Purchase Details
Closed on
Aug 3, 2007
Sold by
Centex Homes
Bought by
Chavez Frank R and Chavez Teresa C
Home Financials for this Owner
Home Financials are based on the most recent Mortgage that was taken out on this home.
Original Mortgage
$94,580
Interest Rate
6.65%
Mortgage Type
Stand Alone Second
Create a Home Valuation Report for This Property
The Home Valuation Report is an in-depth analysis detailing your home's value as well as a comparison with similar homes in the area
Home Values in the Area
Average Home Value in this Area
Purchase History
| Date | Buyer | Sale Price | Title Company |
|---|---|---|---|
| Posey Simon C | $343,000 | Rdelity National Title Co | |
| Chavez Frank R | -- | Commerce Title Company |
Source: Public Records
Mortgage History
| Date | Status | Borrower | Loan Amount |
|---|---|---|---|
| Open | Posey Simon C | $350,374 | |
| Previous Owner | Chavez Frank R | $94,580 |
Source: Public Records
Tax History
| Year | Tax Paid | Tax Assessment Tax Assessment Total Assessment is a certain percentage of the fair market value that is determined by local assessors to be the total taxable value of land and additions on the property. | Land | Improvement |
|---|---|---|---|---|
| 2025 | $4,406 | $412,226 | $96,143 | $316,083 |
| 2023 | $4,406 | $396,220 | $92,410 | $303,810 |
| 2022 | $4,328 | $388,452 | $90,599 | $297,853 |
| 2021 | $4,376 | $380,836 | $88,823 | $292,013 |
| 2020 | $4,329 | $376,932 | $87,913 | $289,019 |
| 2019 | $4,256 | $369,542 | $86,190 | $283,352 |
| 2018 | $4,189 | $362,297 | $84,500 | $277,797 |
| 2017 | $4,112 | $355,194 | $82,844 | $272,350 |
| 2016 | $4,036 | $348,230 | $81,220 | $267,010 |
| 2014 | $3,945 | $336,000 | $123,000 | $213,000 |
Source: Public Records
Map
Nearby Homes
- 1103 Point Sal Loop
- 600 N Y St
- 1212 Timothy Ct
- 1012 W Anthony Way
- 420 N W St
- 516 N U St
- 1445 Crown Cir
- 901 Alden Ave
- 1355 Crown Cir
- 0 Floradale Ave
- 531 N O St
- 112 N X St
- 1408 W Walnut Ave
- 267 Village Circle Dr
- 4314 W Ocean Ave
- 321 W North Ave Unit 133
- 1410 W Apricot Ave
- 1011 W Walnut Ave
- 60 Village Circle Dr
- 23 Village Circle Dr
Your Personal Tour Guide
Ask me questions while you tour the home.