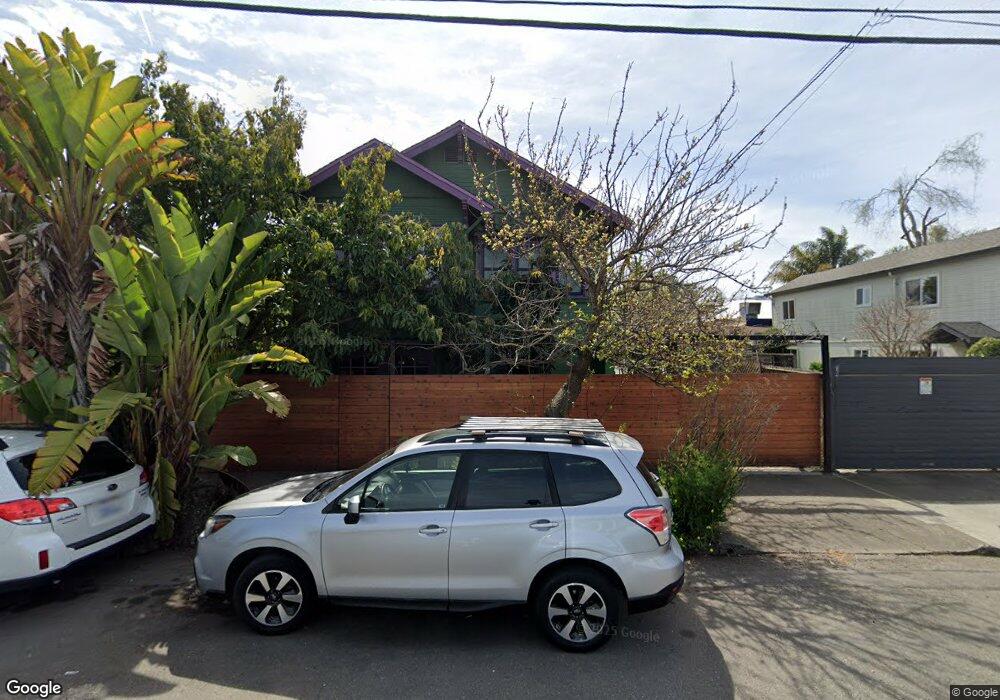
1120 Bancroft Way Berkeley, CA 94702
West Berkeley NeighborhoodEstimated Value: $380,000 - $2,117,000
2
Beds
2
Baths
1,805
Sq Ft
$767/Sq Ft
Est. Value
About This Home
This home is located at 1120 Bancroft Way, Berkeley, CA 94702 and is currently estimated at $1,383,562, approximately $766 per square foot. 1120 Bancroft Way is a home located in Alameda County with nearby schools including Rosa Parks Elementary School, Ruth Acty Elementary, and Berkeley Arts Magnet at Whittier School.
Ownership History
Date
Name
Owned For
Owner Type
Purchase Details
Closed on
Apr 17, 2002
Sold by
Burdick Bryanne J
Bought by
Montgomery James S and Rutherford Mateo C
Current Estimated Value
Home Financials for this Owner
Home Financials are based on the most recent Mortgage that was taken out on this home.
Original Mortgage
$300,000
Outstanding Balance
$120,449
Interest Rate
6.37%
Estimated Equity
$1,263,113
Purchase Details
Closed on
May 22, 1995
Sold by
Montgomery James S and Burdick Bryanne J
Bought by
Montgomery James S and Burdick Bryanne J
Purchase Details
Closed on
Jan 27, 1995
Sold by
Crompton Richard M and Crompton Felice A
Bought by
Montgomery James S and Burdick Bryanne J
Home Financials for this Owner
Home Financials are based on the most recent Mortgage that was taken out on this home.
Original Mortgage
$167,700
Interest Rate
9.2%
Create a Home Valuation Report for This Property
The Home Valuation Report is an in-depth analysis detailing your home's value as well as a comparison with similar homes in the area
Home Values in the Area
Average Home Value in this Area
Purchase History
| Date | Buyer | Sale Price | Title Company |
|---|---|---|---|
| Montgomery James S | $137,000 | First American Title Guarant | |
| Montgomery James S | -- | -- | |
| Montgomery James S | $188,500 | Placer Title Company |
Source: Public Records
Mortgage History
| Date | Status | Borrower | Loan Amount |
|---|---|---|---|
| Open | Montgomery James S | $300,000 | |
| Previous Owner | Montgomery James S | $167,700 |
Source: Public Records
Tax History
| Year | Tax Paid | Tax Assessment Tax Assessment Total Assessment is a certain percentage of the fair market value that is determined by local assessors to be the total taxable value of land and additions on the property. | Land | Improvement |
|---|---|---|---|---|
| 2025 | $8,975 | $412,179 | $124,527 | $294,652 |
| 2024 | $8,975 | $403,962 | $122,086 | $288,876 |
| 2023 | $8,705 | $402,906 | $119,693 | $283,213 |
| 2022 | $8,438 | $388,006 | $117,346 | $277,660 |
| 2021 | $8,423 | $380,261 | $115,045 | $272,216 |
| 2020 | $7,890 | $383,292 | $113,866 | $269,426 |
| 2019 | $7,480 | $375,778 | $111,634 | $264,144 |
| 2018 | $7,313 | $368,411 | $109,445 | $258,966 |
| 2017 | $7,030 | $361,189 | $107,300 | $253,889 |
| 2016 | $6,721 | $354,109 | $105,197 | $248,912 |
| 2015 | $6,610 | $348,791 | $103,617 | $245,174 |
| 2014 | $6,472 | $341,961 | $101,588 | $240,373 |
Source: Public Records
Map
Nearby Homes
- 2327 10th St Unit 4
- 1039 Channing Way
- 2231 Byron St
- 2324 Browning St
- 2241 Ninth St
- 1118 Dwight Way
- 1144 Dwight Way
- 1092 Dwight Way
- 1142 Dwight Way
- 931 Bancroft Way
- 917 Channing Way
- 1230 Addison St
- 2238 7th St
- 2220 7th St
- 1050 Allston Way
- 2411 Sixth St
- 2013 9th St
- 1919 Curtis St
- 2350 Sacramento St
- 1261 Hearst Ave
- 1122 Bancroft Way
- 1112 Bancroft Way
- 1124 Bancroft Way
- 1116 Bancroft Way
- 1108 Bancroft Way
- 1115 Chaucer St
- 1118 Bancroft Way
- 1111 Chaucer St
- 1121 Chaucer St
- 1125 Chaucer St
- 1134 Bancroft Way
- 2242 Byron St
- 1127 Chaucer St
- 1103 Chaucer St
- 1115 Bancroft Way
- 1125 Bancroft Way
- 1131 Chaucer St
- 2310 Curtis St
- 1138 Bancroft Way
- 1127 Bancroft Way
Your Personal Tour Guide
Ask me questions while you tour the home.