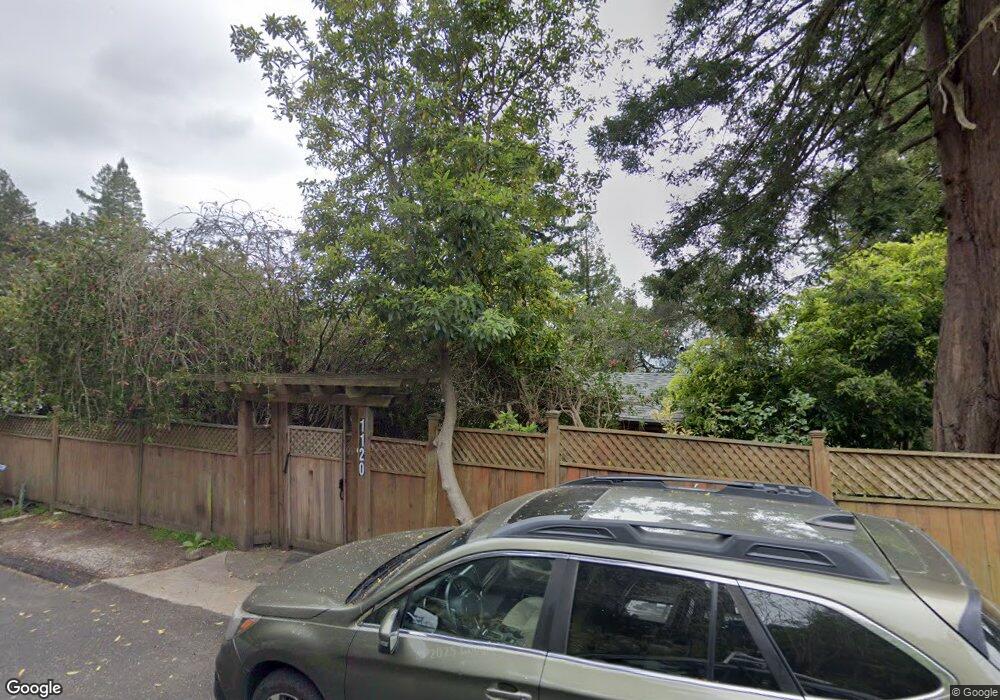
1120 Keith Ave Berkeley, CA 94708
Berkeley Hills NeighborhoodEstimated Value: $1,517,000 - $1,818,000
3
Beds
4
Baths
2,017
Sq Ft
$809/Sq Ft
Est. Value
About This Home
This home is located at 1120 Keith Ave, Berkeley, CA 94708 and is currently estimated at $1,632,579, approximately $809 per square foot. 1120 Keith Ave is a home located in Alameda County with nearby schools including Cragmont Elementary School, Berkeley Arts Magnet at Whittier School, and Washington Elementary School.
Ownership History
Date
Name
Owned For
Owner Type
Purchase Details
Closed on
Nov 7, 2018
Sold by
Lam Rachel
Bought by
Kaleel Michael and Kaleel Catherine
Current Estimated Value
Home Financials for this Owner
Home Financials are based on the most recent Mortgage that was taken out on this home.
Original Mortgage
$840,000
Outstanding Balance
$737,101
Interest Rate
4.7%
Mortgage Type
New Conventional
Estimated Equity
$895,478
Purchase Details
Closed on
Feb 5, 2013
Sold by
Lam Thomas P
Bought by
Lam Rachel
Purchase Details
Closed on
Aug 7, 2012
Sold by
Lam Thomas P and Lam Marilyn S
Bought by
Lam Thomas P
Purchase Details
Closed on
Aug 22, 2001
Sold by
Bacon Frank and Madi Bacon Trust
Bought by
Lam Thomas P and Lam Marilyn S
Home Financials for this Owner
Home Financials are based on the most recent Mortgage that was taken out on this home.
Original Mortgage
$350,000
Interest Rate
6.37%
Create a Home Valuation Report for This Property
The Home Valuation Report is an in-depth analysis detailing your home's value as well as a comparison with similar homes in the area
Home Values in the Area
Average Home Value in this Area
Purchase History
| Date | Buyer | Sale Price | Title Company |
|---|---|---|---|
| Kaleel Michael | $1,050,000 | Chicago Title Company | |
| Lam Rachel | $950,000 | None Available | |
| Lam Thomas P | -- | None Available | |
| Lam Thomas P | $480,000 | Fidelity National Title Co |
Source: Public Records
Mortgage History
| Date | Status | Borrower | Loan Amount |
|---|---|---|---|
| Open | Kaleel Michael | $840,000 | |
| Previous Owner | Lam Thomas P | $350,000 |
Source: Public Records
Tax History
| Year | Tax Paid | Tax Assessment Tax Assessment Total Assessment is a certain percentage of the fair market value that is determined by local assessors to be the total taxable value of land and additions on the property. | Land | Improvement |
|---|---|---|---|---|
| 2025 | $16,291 | $1,171,275 | $557,750 | $613,525 |
| 2024 | $16,291 | $1,148,311 | $546,815 | $601,496 |
| 2023 | $15,970 | $1,125,799 | $536,095 | $589,704 |
| 2022 | $15,725 | $1,103,728 | $525,585 | $578,143 |
| 2021 | $15,789 | $1,082,088 | $515,280 | $566,808 |
| 2020 | $15,058 | $1,071,000 | $510,000 | $561,000 |
| 2019 | $14,592 | $1,050,000 | $500,000 | $550,000 |
| 2018 | $9,906 | $665,640 | $186,953 | $478,687 |
| 2017 | $9,553 | $652,591 | $183,288 | $469,303 |
| 2016 | $9,267 | $639,800 | $179,696 | $460,104 |
| 2015 | $9,147 | $630,191 | $176,997 | $453,194 |
| 2014 | $9,042 | $617,850 | $173,531 | $444,319 |
Source: Public Records
Map
Nearby Homes
- 1106 Cragmont Ave
- 1165 Cragmont Ave
- 1155 Keeler Ave
- 1110 Sterling Ave
- 2315 Eunice St
- 2686 Shasta Rd
- 962 Regal Rd
- 1004 Cragmont Ave
- 1160 Miller Ave
- 2501 Rose Walk
- 1024 Grizzly Peak Blvd
- 1085 Creston Rd
- 938 San Benito Rd
- 2121 Eunice St
- 1221 Grizzly Peak Blvd
- 935 Grizzly Peak Blvd
- 1375 Queens Rd
- 777 Cragmont Ave
- 1950 Hopkins St
- 1515 Oxford St Unit 1D
- 1126 Keith Ave
- 1118 Keith Ave
- 1119 Keith Ave
- 1130 Keith Ave
- 1123 Keith Ave
- 1117 Keith Ave
- 1114 Keith Ave
- 1135 Euclid Ave
- 1134 Keith Ave
- 1139 Euclid Ave
- 1133 Euclid Ave
- 1115 Keith Ave
- 1129 Keith Ave
- 1129 Keith Ave
- 1112 Cragmont Ave
- 1129 Euclid Ave
- 1116 Cragmont Ave
- 1141 Euclid Ave
- 1133 Keith Ave
- 1120 Cragmont Ave
Your Personal Tour Guide
Ask me questions while you tour the home.