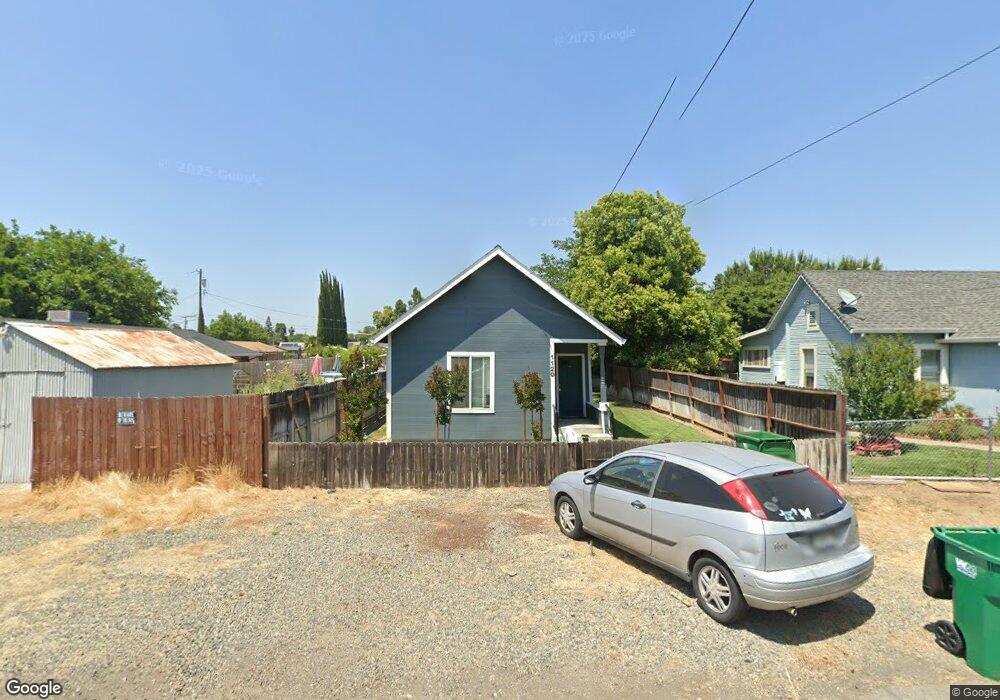
1120 Locust St Gridley, CA 95948
Estimated Value: $134,000 - $220,000
1
Bed
1
Bath
610
Sq Ft
$292/Sq Ft
Est. Value
About This Home
This home is located at 1120 Locust St, Gridley, CA 95948 and is currently estimated at $178,025, approximately $291 per square foot. 1120 Locust St is a home located in Butte County with nearby schools including McKinley Elementary School, Wilson Elementary School, and Sycamore Middle School.
Ownership History
Date
Name
Owned For
Owner Type
Purchase Details
Closed on
Oct 29, 2011
Sold by
Morales Cesar
Bought by
Morales Consuelo
Current Estimated Value
Purchase Details
Closed on
Oct 25, 2002
Sold by
Melton Edward S and Melton Shirley E
Bought by
Morales Cesar and Morales Consuelo
Home Financials for this Owner
Home Financials are based on the most recent Mortgage that was taken out on this home.
Original Mortgage
$40,000
Interest Rate
5.99%
Purchase Details
Closed on
Jun 9, 1999
Sold by
Melton Edward
Bought by
Melton Edward S and Melton Shirley E
Home Financials for this Owner
Home Financials are based on the most recent Mortgage that was taken out on this home.
Original Mortgage
$26,250
Interest Rate
6.9%
Purchase Details
Closed on
Nov 24, 1997
Sold by
Declarati Melton Naomi Simmons and Declarati Naomi Simmons Melton
Bought by
Melton Naomi
Create a Home Valuation Report for This Property
The Home Valuation Report is an in-depth analysis detailing your home's value as well as a comparison with similar homes in the area
Home Values in the Area
Average Home Value in this Area
Purchase History
| Date | Buyer | Sale Price | Title Company |
|---|---|---|---|
| Morales Consuelo | -- | None Available | |
| Morales Cesar | $50,000 | Bidwell Title & Escrow Co | |
| Melton Edward S | -- | Bidwell Title & Escrow Compa | |
| Melton Naomi | -- | -- |
Source: Public Records
Mortgage History
| Date | Status | Borrower | Loan Amount |
|---|---|---|---|
| Closed | Morales Cesar | $40,000 | |
| Previous Owner | Melton Edward S | $26,250 |
Source: Public Records
Tax History
| Year | Tax Paid | Tax Assessment Tax Assessment Total Assessment is a certain percentage of the fair market value that is determined by local assessors to be the total taxable value of land and additions on the property. | Land | Improvement |
|---|---|---|---|---|
| 2025 | $843 | $72,389 | $47,058 | $25,331 |
| 2024 | $843 | $70,971 | $46,136 | $24,835 |
| 2023 | $838 | $69,581 | $45,232 | $24,349 |
| 2022 | $786 | $68,218 | $44,346 | $23,872 |
| 2021 | $766 | $66,881 | $43,477 | $23,404 |
| 2020 | $764 | $66,197 | $43,032 | $23,165 |
| 2019 | $751 | $64,900 | $42,189 | $22,711 |
| 2018 | $739 | $63,628 | $41,362 | $22,266 |
| 2017 | $725 | $62,381 | $40,551 | $21,830 |
| 2016 | $697 | $61,158 | $39,756 | $21,402 |
| 2015 | $756 | $60,240 | $39,159 | $21,081 |
| 2014 | $746 | $59,061 | $38,392 | $20,669 |
Source: Public Records
Map
Nearby Homes
Your Personal Tour Guide
Ask me questions while you tour the home.