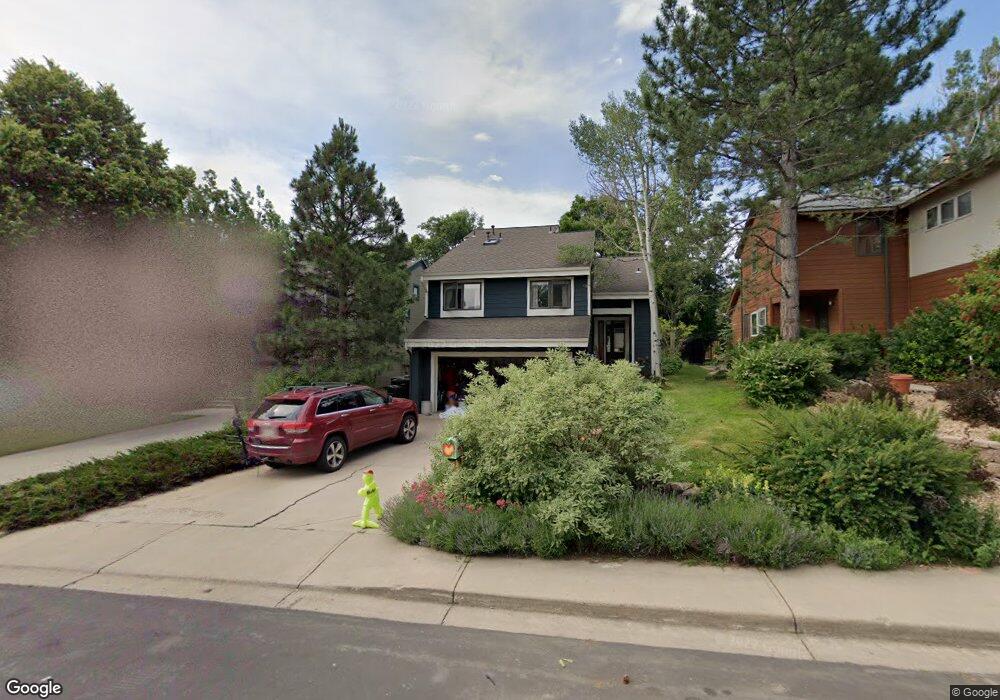
1120 Orange Place Boulder, CO 80304
Wonderland NeighborhoodEstimated Value: $1,178,000 - $1,508,000
3
Beds
3
Baths
2,292
Sq Ft
$596/Sq Ft
Est. Value
About This Home
This home is located at 1120 Orange Place, Boulder, CO 80304 and is currently estimated at $1,365,033, approximately $595 per square foot. 1120 Orange Place is a home located in Boulder County with nearby schools including Foothill Elementary School, Centennial Middle School, and Boulder High School.
Ownership History
Date
Name
Owned For
Owner Type
Purchase Details
Closed on
May 6, 2011
Sold by
Tagley Paul P and Easley Jennifer L
Bought by
Tagley Paul P
Current Estimated Value
Home Financials for this Owner
Home Financials are based on the most recent Mortgage that was taken out on this home.
Original Mortgage
$415,000
Outstanding Balance
$288,804
Interest Rate
4.91%
Mortgage Type
New Conventional
Estimated Equity
$1,076,229
Purchase Details
Closed on
Sep 30, 2005
Sold by
Israel Marilyn J
Bought by
Tagley Paul P
Home Financials for this Owner
Home Financials are based on the most recent Mortgage that was taken out on this home.
Original Mortgage
$410,000
Interest Rate
5.87%
Mortgage Type
Purchase Money Mortgage
Purchase Details
Closed on
May 4, 1994
Sold by
Zammuto Raymond F
Bought by
Israel Marilyn J
Purchase Details
Closed on
Aug 2, 1988
Bought by
Tagley Paul P and Tagley Jennifer L
Purchase Details
Closed on
Jan 24, 1984
Bought by
Tagley Paul P and Tagley Jennifer L
Purchase Details
Closed on
Aug 12, 1980
Bought by
Tagley Paul P and Tagley Jennifer L
Create a Home Valuation Report for This Property
The Home Valuation Report is an in-depth analysis detailing your home's value as well as a comparison with similar homes in the area
Home Values in the Area
Average Home Value in this Area
Purchase History
| Date | Buyer | Sale Price | Title Company |
|---|---|---|---|
| Tagley Paul P | -- | Land Title Guarantee Company | |
| Tagley Paul P | $512,500 | Fahtco | |
| Israel Marilyn J | -- | -- | |
| Tagley Paul P | $167,500 | -- | |
| Tagley Paul P | $32,000 | -- | |
| Tagley Paul P | -- | -- |
Source: Public Records
Mortgage History
| Date | Status | Borrower | Loan Amount |
|---|---|---|---|
| Open | Tagley Paul P | $415,000 | |
| Closed | Tagley Paul P | $410,000 |
Source: Public Records
Tax History
| Year | Tax Paid | Tax Assessment Tax Assessment Total Assessment is a certain percentage of the fair market value that is determined by local assessors to be the total taxable value of land and additions on the property. | Land | Improvement |
|---|---|---|---|---|
| 2025 | $8,272 | $85,594 | $58,875 | $26,719 |
| 2024 | $8,272 | $85,594 | $58,875 | $26,719 |
| 2023 | $8,105 | $92,668 | $64,253 | $32,100 |
| 2022 | $7,770 | $82,274 | $51,479 | $30,795 |
| 2021 | $7,394 | $84,642 | $52,960 | $31,682 |
| 2020 | $5,831 | $66,145 | $38,539 | $27,606 |
| 2019 | $5,761 | $66,145 | $38,539 | $27,606 |
| 2018 | $5,183 | $58,990 | $25,560 | $33,430 |
| 2017 | $5,019 | $65,216 | $28,258 | $36,958 |
| 2016 | $4,982 | $56,818 | $36,616 | $20,202 |
| 2015 | $4,720 | $43,875 | $13,850 | $30,025 |
| 2014 | $3,745 | $43,875 | $13,850 | $30,025 |
Source: Public Records
Map
Nearby Homes
- 1180 Oakdale Place
- 1152 Orange Place
- 3840 Broadway St Unit 26
- 3850 Broadway St Unit 24
- 4893 Broadway
- 1110 Poplar Ave
- 3776 Orange Ln
- 1285 Meadow Place
- 1205 Meadow Ave
- 3877 15th St
- 1505 Oak Ave
- 1487 Periwinkle Dr
- 785 Northstar Ct
- 1620 Oak Ave
- 630 Northstar Ct
- 1690 Wilson Ct
- 865 Kalmia Ave
- 1695 Orchard Ave
- 670 Quince Cir
- 3660 16th St
- 1092 Orange Place
- 1122 Orange Place
- 1090 Orange Place
- 1150 Orange Place
- 1052 Orange Place
- 3791 Mountain Laurel Place
- 1050 Orange Place
- 3794 Orange Ln
- 1125 Orange Place
- 1097 Orange Place
- 1095 Orange Place
- 1127 Orange Place
- 1174 Orange Place
- 1155 Orange Place
- 1067 Orange Place
- 1192 Orange Place
- 1065 Orange Place
- 1157 Orange Place
- 1037 Orange Place
- 1195 Orange Place
Your Personal Tour Guide
Ask me questions while you tour the home.