Estimated Value: $418,130 - $478,000
4
Beds
3
Baths
2,432
Sq Ft
$185/Sq Ft
Est. Value
About This Home
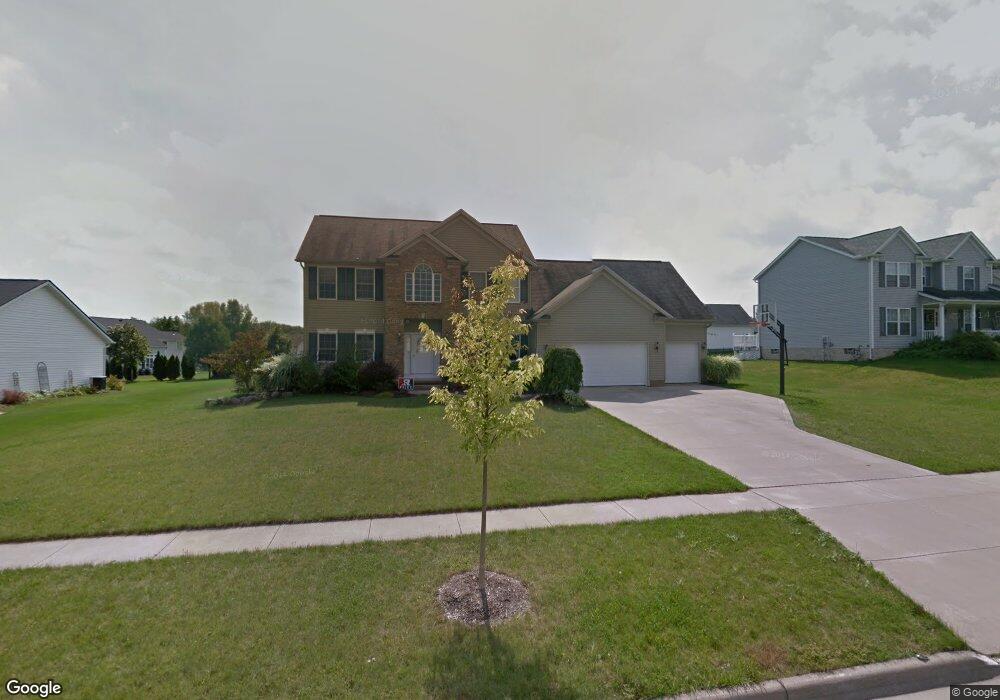
This home is located at 1120 Windward Ln, Kent, OH 44240 and is currently estimated at $449,783, approximately $184 per square foot. 1120 Windward Ln is a home located in Portage County with nearby schools including Longcoy Elementary School, Stanton Middle School, and Theodore Roosevelt High School.
Ownership History
Date
Name
Owned For
Owner Type
Purchase Details
Closed on
Jul 21, 2020
Sold by
Pensyl Terry A and Pensyl Dawn R
Bought by
Coker Christopher D and Coker Sara
Current Estimated Value
Home Financials for this Owner
Home Financials are based on the most recent Mortgage that was taken out on this home.
Original Mortgage
$274,611
Outstanding Balance
$243,959
Interest Rate
3.2%
Mortgage Type
New Conventional
Estimated Equity
$205,824
Purchase Details
Closed on
Aug 31, 2001
Sold by
Mosley Building Corp
Bought by
Pensyl Terry A and Pensyl Dawn R
Home Financials for this Owner
Home Financials are based on the most recent Mortgage that was taken out on this home.
Original Mortgage
$203,900
Interest Rate
7.11%
Purchase Details
Closed on
Aug 23, 2000
Sold by
Forest Lakes Development Co Ltd
Bought by
Mosley Building Corp
Home Financials for this Owner
Home Financials are based on the most recent Mortgage that was taken out on this home.
Original Mortgage
$182,900
Interest Rate
7.98%
Create a Home Valuation Report for This Property
The Home Valuation Report is an in-depth analysis detailing your home's value as well as a comparison with similar homes in the area
Home Values in the Area
Average Home Value in this Area
Purchase History
| Date | Buyer | Sale Price | Title Company |
|---|---|---|---|
| Coker Christopher D | $320,000 | None Available | |
| Pensyl Terry A | $254,900 | Bond & Associates Title Agen | |
| Mosley Building Corp | $61,900 | Midland Commerce Group |
Source: Public Records
Mortgage History
| Date | Status | Borrower | Loan Amount |
|---|---|---|---|
| Open | Coker Christopher D | $274,611 | |
| Closed | Pensyl Terry A | $203,900 | |
| Closed | Mosley Building Corp | $182,900 | |
| Closed | Mosley Building Corp | $9,285 |
Source: Public Records
Tax History Compared to Growth
Tax History
| Year | Tax Paid | Tax Assessment Tax Assessment Total Assessment is a certain percentage of the fair market value that is determined by local assessors to be the total taxable value of land and additions on the property. | Land | Improvement |
|---|---|---|---|---|
| 2024 | $5,312 | $118,510 | $15,750 | $102,760 |
| 2023 | $5,434 | $98,000 | $15,750 | $82,250 |
| 2022 | $5,407 | $98,000 | $15,750 | $82,250 |
| 2021 | $5,407 | $98,000 | $15,750 | $82,250 |
| 2020 | $5,761 | $90,510 | $15,750 | $74,760 |
| 2019 | $5,763 | $90,510 | $15,750 | $74,760 |
| 2018 | $5,529 | $80,330 | $14,000 | $66,330 |
| 2017 | $5,529 | $80,330 | $14,000 | $66,330 |
| 2016 | $5,516 | $80,330 | $14,000 | $66,330 |
| 2015 | $5,518 | $80,330 | $14,000 | $66,330 |
| 2014 | $5,390 | $77,180 | $14,000 | $63,180 |
| 2013 | $5,352 | $77,180 | $14,000 | $63,180 |
Source: Public Records
Map
Nearby Homes
- 978 Silver Meadows Blvd
- 4451 Newcomer Rd
- 940 Kevin Dr
- 3165 Peterboro Dr
- 600 Silver Meadows Blvd
- 2908 Wexford Blvd
- 1037 Verona Dr
- 4035 Villas Dr
- 4233 Smokerise Dr
- 1265 W Main St
- 1046 Hudson Rd
- 2991 Heatherwood Ct Unit 30B
- 4227 Maribend Dr
- 3896 Lake Run Blvd
- 529 Rockwell St
- 474 W Grant St
- 2973 Mourning Dove Cir
- 510 Earl Ave
- 3127 Deercrest Path
- 505 Longmere Dr
- 1126 Windward Ln
- 1114 Windward Ln
- 1425 Sunset Way Blvd
- 1407 Sunset Way Blvd
- 1419 Sunset Way Blvd
- 1418 Lakewood Cir
- 1121 Windward Ln
- 1132 Windward Ln
- 1412 Lakewood Cir
- 1127 Windward Ln
- 1115 Windward Ln
- 1424 Sunset Way Blvd
- 1133 Windward Ln
- 1307 Windward Ln
- 1313 Windward Ln
- 1138 Windward Ln
- 1395 Sunset Way Blvd
- 1430 Sunset Way Blvd
- 1418 Sunset Way Blvd
- 1412 Sunset Way Blvd