Estimated Value: $689,000 - $798,000
5
Beds
3
Baths
2,490
Sq Ft
$302/Sq Ft
Est. Value
About This Home
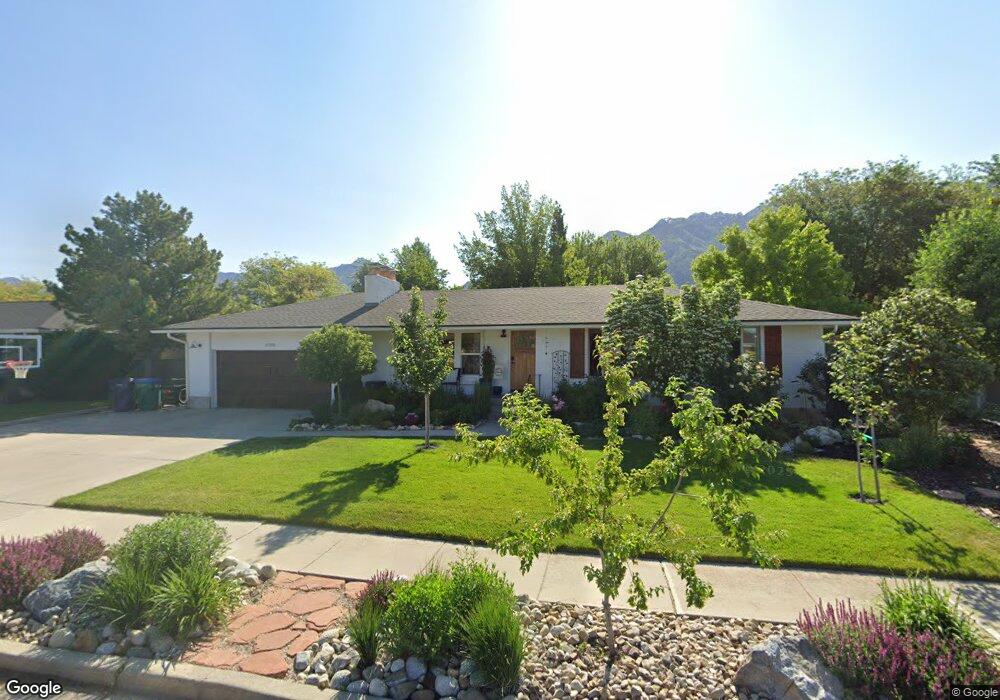
This home is located at 11205 S 1835 E, Sandy, UT 84092 and is currently estimated at $751,002, approximately $301 per square foot. 11205 S 1835 E is a home located in Salt Lake County with nearby schools including Sunrise Elementary School, Bell Canyon Montessori School, and Challenger School - Sandy.
Ownership History
Date
Name
Owned For
Owner Type
Purchase Details
Closed on
May 30, 2017
Sold by
Pierce Jeremy
Bought by
Mackey Scott and Mackey Stacy
Current Estimated Value
Home Financials for this Owner
Home Financials are based on the most recent Mortgage that was taken out on this home.
Original Mortgage
$351,976
Outstanding Balance
$292,369
Interest Rate
3.97%
Mortgage Type
Purchase Money Mortgage
Estimated Equity
$458,633
Purchase Details
Closed on
Nov 18, 2011
Sold by
Kiser Marye Jane
Bought by
Pierce Jeremy
Home Financials for this Owner
Home Financials are based on the most recent Mortgage that was taken out on this home.
Original Mortgage
$208,000
Interest Rate
3.75%
Mortgage Type
FHA
Purchase Details
Closed on
Nov 11, 2009
Sold by
Kiser Anthony J
Bought by
Kiser Marye Jane
Purchase Details
Closed on
Sep 25, 2000
Sold by
Miller Gail L
Bought by
Kiser Anthony J and Kiser Marye Jane
Home Financials for this Owner
Home Financials are based on the most recent Mortgage that was taken out on this home.
Original Mortgage
$170,034
Interest Rate
8.07%
Mortgage Type
VA
Create a Home Valuation Report for This Property
The Home Valuation Report is an in-depth analysis detailing your home's value as well as a comparison with similar homes in the area
Home Values in the Area
Average Home Value in this Area
Purchase History
| Date | Buyer | Sale Price | Title Company |
|---|---|---|---|
| Mackey Scott | -- | Novation Title Ins Agcy | |
| Pierce Jeremy | -- | United Title Services | |
| Kiser Marye Jane | -- | Founders Title | |
| Kiser Anthony J | -- | Landmark Title |
Source: Public Records
Mortgage History
| Date | Status | Borrower | Loan Amount |
|---|---|---|---|
| Open | Mackey Scott | $351,976 | |
| Previous Owner | Pierce Jeremy | $208,000 | |
| Previous Owner | Kiser Anthony J | $170,034 |
Source: Public Records
Tax History
| Year | Tax Paid | Tax Assessment Tax Assessment Total Assessment is a certain percentage of the fair market value that is determined by local assessors to be the total taxable value of land and additions on the property. | Land | Improvement |
|---|---|---|---|---|
| 2025 | $3,774 | $698,800 | $263,200 | $435,600 |
| 2024 | $3,774 | $697,900 | $253,300 | $444,600 |
| 2023 | $3,430 | $632,400 | $243,600 | $388,800 |
| 2022 | $3,101 | $558,600 | $238,800 | $319,800 |
| 2021 | $2,745 | $421,000 | $193,000 | $228,000 |
| 2020 | $2,613 | $377,900 | $193,000 | $184,900 |
| 2019 | $2,495 | $351,600 | $182,100 | $169,500 |
| 2016 | $1,878 | $254,500 | $164,100 | $90,400 |
Source: Public Records
Map
Nearby Homes
- 11318 Canyon Falls Ln
- 11382 S Canyon Falls Ln
- 1653 Crescent View Dr
- 11341 S Silver Buckle Way
- 11129 S 2125 E
- 10868 Prescott Dr
- 7 Rollingwood Ln
- 2026 E 10765 S
- 2234 E Willow Brook Way
- 11343 Clifford Cir
- 2192 E High Mesa Dr
- 16 Gatehouse Ln
- 1320 E Woodhill Cir
- 2015 E Dimple Dell Rd
- 2250 High Mountain Dr
- 1 Quietwood Ln
- 2232 E Lone Eagle Ln
- 11446 S 2320 E
- 5 Quietwood Ln
- 1234 E Sandy Ridge Dr
- 11205 Teakwood Cir
- 11215 S 1835 E
- 11185 Teakwood Dr
- 11185 Teakwood Dr
- 11185 S 1835 E
- 11196 S Foxmoor Dr
- 11196 Foxmoor Dr
- 11184 Foxmoor Dr
- 11184 S Foxmoor Dr
- 11210 S 1835 Dr E
- 11200 S Teakwood Dr
- 11208 S Foxmoor Dr
- 11208 Foxmoor Dr
- 1822 E 11170 S
- 11221 S 1835 E
- 1821 Teakwood Dr
- 1821 E Teakwood Dr
- 11220 Foxmoor Dr
- 1843 E 11170 S
- 11156 S 1865 E
Your Personal Tour Guide
Ask me questions while you tour the home.