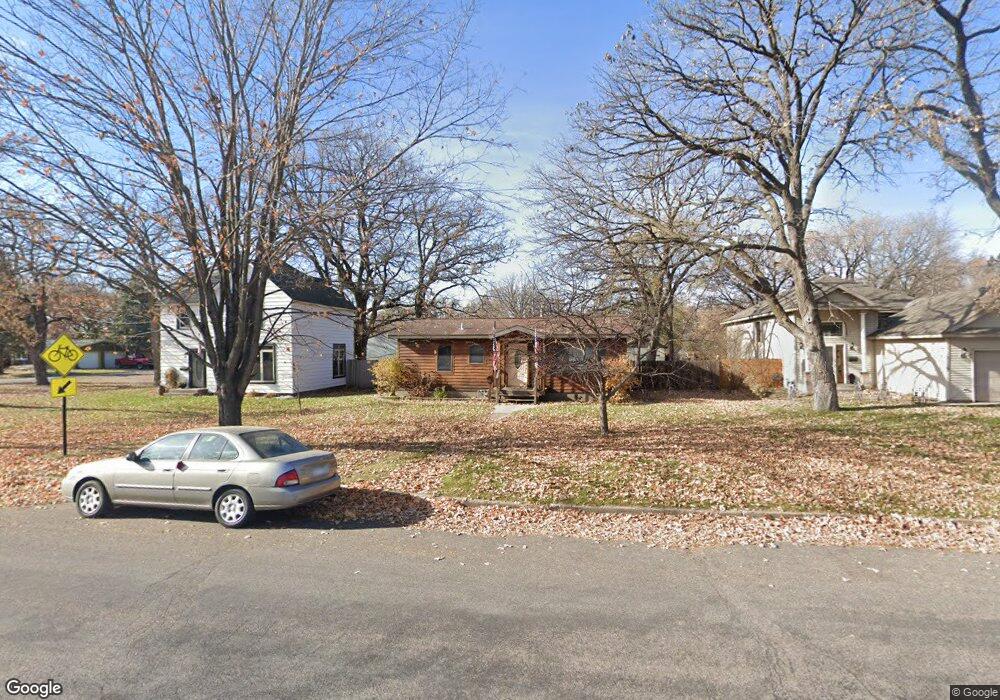
1121 Broadway Ave S Sauk Rapids, MN 56379
Estimated Value: $196,000 - $469,205
2
Beds
1
Bath
864
Sq Ft
$317/Sq Ft
Est. Value
About This Home
This home is located at 1121 Broadway Ave S, Sauk Rapids, MN 56379 and is currently estimated at $274,301, approximately $317 per square foot. 1121 Broadway Ave S is a home located in Benton County with nearby schools including Mississippi Heights Elementary School, Sauk Rapids-Rice Middle School, and Sauk Rapids-Rice Senior High School.
Ownership History
Date
Name
Owned For
Owner Type
Purchase Details
Closed on
Dec 15, 2017
Sold by
Schaefer Samantha
Bought by
Mcpherson John M
Current Estimated Value
Home Financials for this Owner
Home Financials are based on the most recent Mortgage that was taken out on this home.
Original Mortgage
$104
Outstanding Balance
$88
Interest Rate
3.95%
Mortgage Type
Unknown
Estimated Equity
$274,213
Purchase Details
Closed on
May 30, 2008
Sold by
Fremont Investment And Loan
Bought by
Schaefer Samantha
Home Financials for this Owner
Home Financials are based on the most recent Mortgage that was taken out on this home.
Original Mortgage
$93,758
Interest Rate
6%
Mortgage Type
FHA
Purchase Details
Closed on
Aug 26, 2005
Sold by
Sklenicka Corey I and Crutaire Salle
Bought by
Sevcik Drew
Home Financials for this Owner
Home Financials are based on the most recent Mortgage that was taken out on this home.
Original Mortgage
$100,000
Interest Rate
5.89%
Mortgage Type
Adjustable Rate Mortgage/ARM
Create a Home Valuation Report for This Property
The Home Valuation Report is an in-depth analysis detailing your home's value as well as a comparison with similar homes in the area
Home Values in the Area
Average Home Value in this Area
Purchase History
| Date | Buyer | Sale Price | Title Company |
|---|---|---|---|
| Mcpherson John M | $300,000 | None Available | |
| Schaefer Samantha | $94,500 | -- | |
| Sevcik Drew | $125,000 | -- |
Source: Public Records
Mortgage History
| Date | Status | Borrower | Loan Amount |
|---|---|---|---|
| Open | Mcpherson John M | $104 | |
| Previous Owner | Schaefer Samantha | $93,758 | |
| Previous Owner | Sevcik Drew | $100,000 |
Source: Public Records
Tax History Compared to Growth
Tax History
| Year | Tax Paid | Tax Assessment Tax Assessment Total Assessment is a certain percentage of the fair market value that is determined by local assessors to be the total taxable value of land and additions on the property. | Land | Improvement |
|---|---|---|---|---|
| 2025 | $1,650 | $163,300 | $30,400 | $132,900 |
| 2024 | $1,652 | $156,400 | $30,400 | $126,000 |
| 2023 | $1,566 | $155,700 | $30,400 | $125,300 |
| 2022 | $1,376 | $138,300 | $27,700 | $110,600 |
| 2021 | $1,246 | $116,200 | $27,700 | $88,500 |
| 2020 | $1,228 | $108,200 | $26,600 | $81,600 |
| 2018 | $1,060 | $70,200 | $18,938 | $51,262 |
| 2017 | $1,060 | $64,000 | $18,325 | $45,675 |
| 2016 | $1,516 | $89,500 | $26,600 | $62,900 |
| 2015 | $1,374 | $54,900 | $17,282 | $37,618 |
| 2014 | -- | $51,500 | $16,829 | $34,671 |
| 2013 | -- | $52,400 | $16,957 | $35,443 |
Source: Public Records
Map
Nearby Homes
- 1011 Water Ave S
- 1409 3rd Ave S
- 1804 8th Ave S
- 1803 8th Ave S
- 526 4th Ave NE
- 525 4th Ave NE
- 608 Summit Ave S
- 1415 7th Ave N
- 1715 Hillcrest Rd
- 430 5th Ave NE
- 1403 8th Ave N
- 1253 7th Ave N
- 1340 9th Ave N
- 1021 5th St S
- 915 7th Ave N
- 1010 8th Ave N
- 717 6th Ave N
- 307 2nd Ave NE
- 220 4th Ave NE
- 1 Skyview Dr
- 1117 Broadway Ave S
- 1125 Broadway Ave S
- 1105 Broadway Ave S
- 1201 Broadway Ave S
- 1128 River Ave S
- 1120 River Ave S
- 1103 Broadway Ave S
- 1124 Broadway Ave S
- 1116 Broadway Ave S
- 1130 Broadway Ave S
- 1112 Broadway Ave S
- 1101 Broadway Ave S
- 1108 Broadway Ave S
- 1205 Broadway Ave S
- 1104 Broadway Ave S
- 1206 Riverview Ct
- 1200 Broadway Ave S
- 1100 River Ave S
- 1206 Broadway Ave S
- 1102 Broadway Ave S