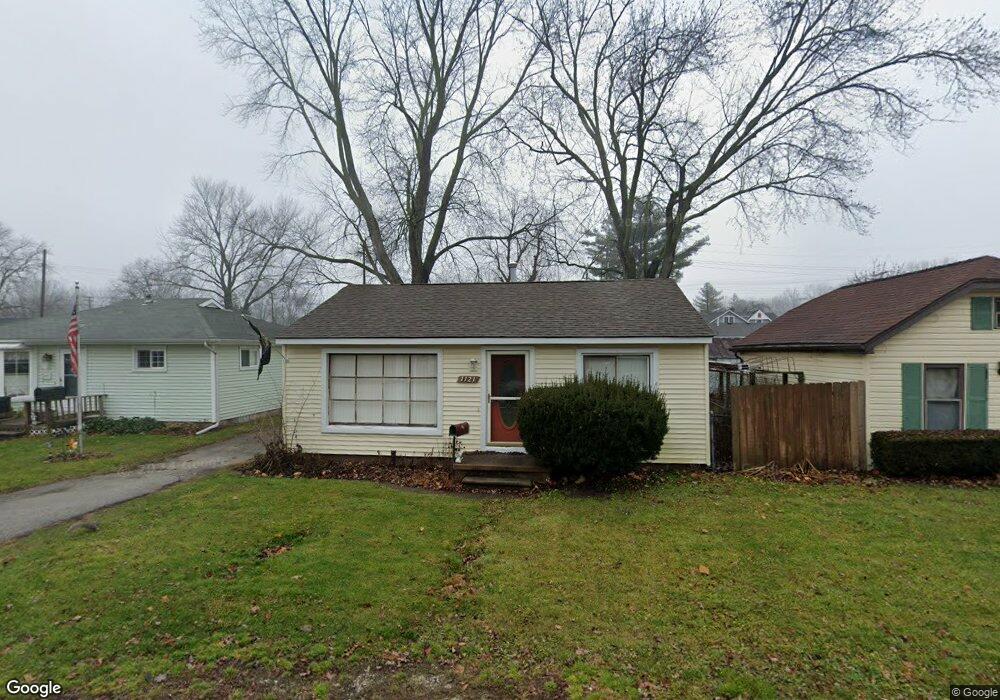
1121 Clinton St Algonac, MI 48001
Estimated Value: $137,632 - $155,000
2
Beds
1
Bath
720
Sq Ft
$202/Sq Ft
Est. Value
About This Home
This home is located at 1121 Clinton St, Algonac, MI 48001 and is currently estimated at $145,658, approximately $202 per square foot. 1121 Clinton St is a home located in St. Clair County.
Ownership History
Date
Name
Owned For
Owner Type
Purchase Details
Closed on
Jul 12, 2019
Sold by
Susan Zappa
Bought by
Oldford Property Company Llc
Current Estimated Value
Purchase Details
Closed on
Jul 9, 2019
Sold by
Susan Zappa
Bought by
Oldford Property Company Llc
Purchase Details
Closed on
Jun 18, 2010
Sold by
Oldford Eugene D
Bought by
Dresbach James N
Home Financials for this Owner
Home Financials are based on the most recent Mortgage that was taken out on this home.
Original Mortgage
$39,900
Interest Rate
6%
Mortgage Type
Seller Take Back
Purchase Details
Closed on
Aug 8, 2008
Sold by
Mortgage Electronic Registration Systems
Bought by
Bank Of New York
Purchase Details
Closed on
Aug 7, 2008
Sold by
Couch Richard S
Bought by
Mortgage Electronic Registration Systems
Create a Home Valuation Report for This Property
The Home Valuation Report is an in-depth analysis detailing your home's value as well as a comparison with similar homes in the area
Home Values in the Area
Average Home Value in this Area
Purchase History
| Date | Buyer | Sale Price | Title Company |
|---|---|---|---|
| Oldford Property Company Llc | -- | None Listed On Document | |
| Oldford Property Company Llc | -- | None Listed On Document | |
| Dresbach James N | $49,900 | Title One Inc | |
| Bank Of New York | -- | None Available | |
| Mortgage Electronic Registration Systems | $46,480 | None Available |
Source: Public Records
Mortgage History
| Date | Status | Borrower | Loan Amount |
|---|---|---|---|
| Previous Owner | Dresbach James N | $39,900 |
Source: Public Records
Tax History
| Year | Tax Paid | Tax Assessment Tax Assessment Total Assessment is a certain percentage of the fair market value that is determined by local assessors to be the total taxable value of land and additions on the property. | Land | Improvement |
|---|---|---|---|---|
| 2025 | $746 | $61,800 | $0 | $0 |
| 2024 | $1,028 | $51,700 | $0 | $0 |
| 2023 | $945 | $48,200 | $0 | $0 |
| 2022 | $988 | $43,200 | $0 | $0 |
| 2020 | $952 | $38,000 | $12,500 | $25,500 |
| 2019 | $941 | $29,900 | $0 | $0 |
| 2018 | $923 | $28,400 | $0 | $0 |
| 2017 | $878 | $24,800 | $0 | $0 |
| 2016 | $819 | $24,800 | $0 | $0 |
| 2015 | -- | $21,100 | $12,500 | $8,600 |
| 2014 | -- | $19,000 | $12,500 | $6,500 |
| 2013 | -- | $18,100 | $0 | $0 |
Source: Public Records
Map
Nearby Homes
- 1523 Saint Clair River Dr
- 1609 Saint Clair River Dr
- 1719 Saint Clair River Dr
- 1516 Saint Clair River Dr
- 130 Delta Dr
- 1806 Michigan St
- 1103 Beth Ct
- 114 Interlochen Dr
- 710 Ruskin Ave
- 304 Kama Ct
- 408 Conley St
- 724 Townsend Dr
- 474 South St
- 142 Channel Syde Dr
- 9642 Nook Rd Unit 7
- 429 Edgewater Dr
- 226 Roselawn St
- 00 Roselawn St
- 2037 W Park Dr
- 468 Russell Rd
Your Personal Tour Guide
Ask me questions while you tour the home.