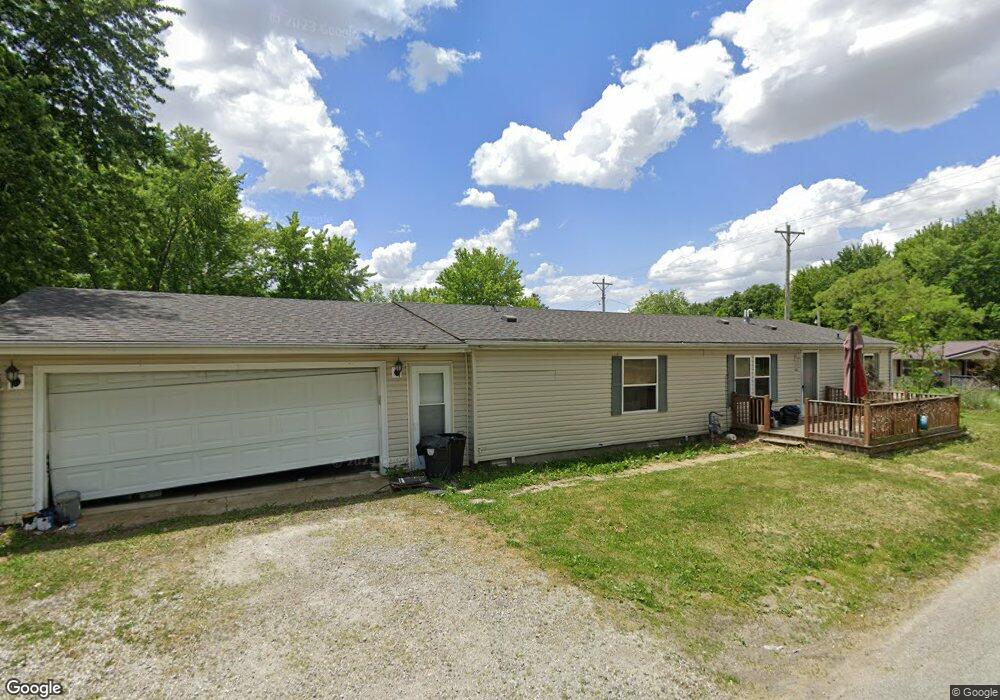
1121 E Campbell St Warren, IN 46792
Estimated Value: $152,518 - $185,000
4
Beds
2
Baths
1,510
Sq Ft
$112/Sq Ft
Est. Value
About This Home
This home is located at 1121 E Campbell St, Warren, IN 46792 and is currently estimated at $168,380, approximately $111 per square foot. 1121 E Campbell St is a home located in Huntington County with nearby schools including Salamonie School and Huntington North High School.
Ownership History
Date
Name
Owned For
Owner Type
Purchase Details
Closed on
Mar 28, 2023
Sold by
Reed Amanda L
Bought by
Feltner Freida
Current Estimated Value
Purchase Details
Closed on
Jun 10, 2020
Sold by
Feltner Freida I
Bought by
Reed Amanda L
Purchase Details
Closed on
Jan 10, 2012
Sold by
Fannie Mae
Bought by
Feltner Frieda I
Purchase Details
Closed on
Aug 13, 2010
Sold by
Bac Home Loans Servicing Lp
Bought by
Federal National Mortgage Association
Purchase Details
Closed on
Jul 27, 2010
Sold by
Kent Farthing Sheriff Of Htgn Co
Bought by
Bac Home Loans Servicing Lp
Create a Home Valuation Report for This Property
The Home Valuation Report is an in-depth analysis detailing your home's value as well as a comparison with similar homes in the area
Home Values in the Area
Average Home Value in this Area
Purchase History
| Date | Buyer | Sale Price | Title Company |
|---|---|---|---|
| Feltner Freida | -- | -- | |
| Reed Amanda L | -- | None Available | |
| Feltner Frieda I | $17,000 | Nreis | |
| Federal National Mortgage Association | -- | None Available | |
| Bac Home Loans Servicing Lp | $73,000 | -- |
Source: Public Records
Tax History Compared to Growth
Tax History
| Year | Tax Paid | Tax Assessment Tax Assessment Total Assessment is a certain percentage of the fair market value that is determined by local assessors to be the total taxable value of land and additions on the property. | Land | Improvement |
|---|---|---|---|---|
| 2024 | $712 | $94,000 | $6,900 | $87,100 |
| 2023 | $1,720 | $85,900 | $6,900 | $79,000 |
| 2022 | $1,512 | $75,500 | $6,900 | $68,600 |
| 2021 | $1,382 | $69,000 | $6,900 | $62,100 |
| 2020 | $81 | $58,100 | $6,900 | $51,200 |
| 2019 | $77 | $58,100 | $6,900 | $51,200 |
| 2018 | $85 | $58,800 | $6,900 | $51,900 |
| 2017 | $79 | $58,700 | $6,900 | $51,800 |
| 2016 | $52 | $55,900 | $6,900 | $49,000 |
| 2014 | $45 | $54,700 | $6,900 | $47,800 |
| 2013 | $45 | $56,400 | $6,900 | $49,500 |
Source: Public Records
Map
Nearby Homes
- TBD Bennett Dr
- 911 N Wayne St
- 907 N Main St
- 511 N Nancy St
- 325 N Wayne St
- 412 N Nancy St
- 10199 S Wayne Rd
- 627 E Jefferson St
- 11899 S Hartford City Rd
- I 69 E 700 N
- 2801 W 600 S
- 2454 S 300 E
- 6124 S 600 W
- 3659 S Warren Rd
- 503 E Main St
- 111 W Penn St
- 9964 E 400 N
- 201 E Vine St
- 5510 W 1000 S
- 603 W Main St