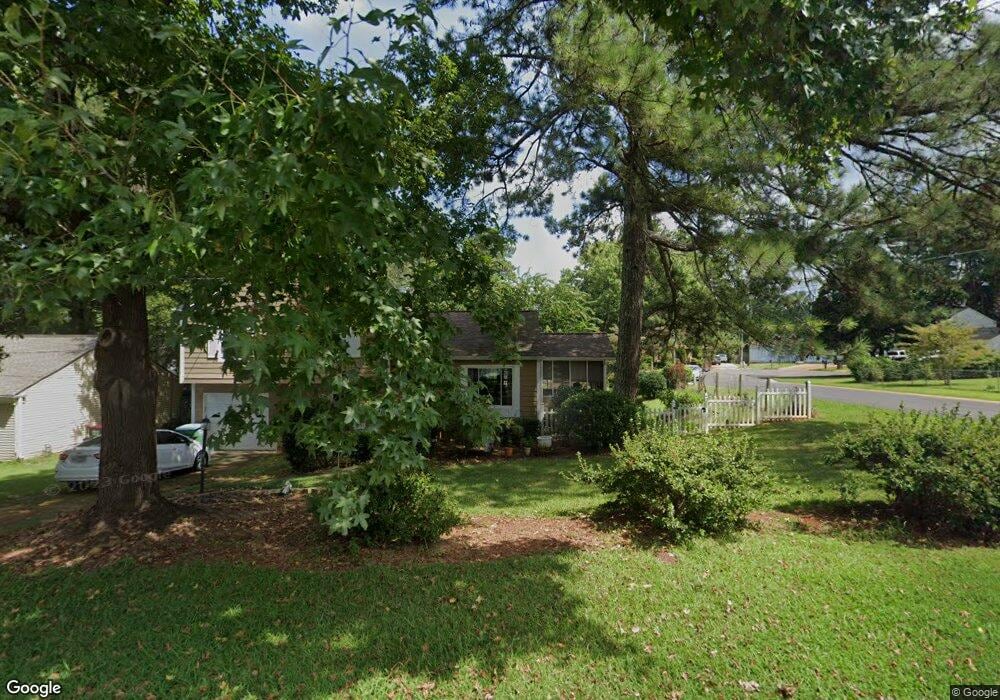
1121 Riva Ridge Dr Unit 2 Norcross, GA 30093
Estimated Value: $310,048 - $384,000
3
Beds
2
Baths
1,056
Sq Ft
$324/Sq Ft
Est. Value
About This Home
This home is located at 1121 Riva Ridge Dr Unit 2, Norcross, GA 30093 and is currently estimated at $342,012, approximately $323 per square foot. 1121 Riva Ridge Dr Unit 2 is a home located in Gwinnett County with nearby schools including Lilburn Elementary School, Lilburn Middle School, and Meadowcreek High School.
Ownership History
Date
Name
Owned For
Owner Type
Purchase Details
Closed on
Aug 18, 2023
Sold by
Mastrocola Wendy Ann
Bought by
Johnson Donald Francis and Mastrocola Wendy Ann
Current Estimated Value
Home Financials for this Owner
Home Financials are based on the most recent Mortgage that was taken out on this home.
Original Mortgage
$170,500
Outstanding Balance
$166,256
Interest Rate
6.78%
Mortgage Type
New Conventional
Estimated Equity
$175,756
Purchase Details
Closed on
Feb 19, 1998
Sold by
Koonin Harriet W and Koonin Boris
Bought by
Mastrocola Wendy A
Home Financials for this Owner
Home Financials are based on the most recent Mortgage that was taken out on this home.
Original Mortgage
$82,550
Interest Rate
6.86%
Mortgage Type
New Conventional
Create a Home Valuation Report for This Property
The Home Valuation Report is an in-depth analysis detailing your home's value as well as a comparison with similar homes in the area
Home Values in the Area
Average Home Value in this Area
Purchase History
| Date | Buyer | Sale Price | Title Company |
|---|---|---|---|
| Johnson Donald Francis | -- | -- | |
| Mastrocola Wendy A | $86,900 | -- |
Source: Public Records
Mortgage History
| Date | Status | Borrower | Loan Amount |
|---|---|---|---|
| Open | Johnson Donald Francis | $170,500 | |
| Previous Owner | Mastrocola Wendy A | $82,550 |
Source: Public Records
Tax History Compared to Growth
Tax History
| Year | Tax Paid | Tax Assessment Tax Assessment Total Assessment is a certain percentage of the fair market value that is determined by local assessors to be the total taxable value of land and additions on the property. | Land | Improvement |
|---|---|---|---|---|
| 2025 | $672 | $108,600 | $21,120 | $87,480 |
| 2024 | $668 | $103,080 | $21,120 | $81,960 |
| 2023 | $668 | $95,360 | $20,000 | $75,360 |
| 2022 | $627 | $85,880 | $14,000 | $71,880 |
| 2021 | $615 | $61,920 | $14,000 | $47,920 |
| 2020 | $1,923 | $61,920 | $14,000 | $47,920 |
| 2019 | $1,261 | $48,680 | $11,600 | $37,080 |
| 2018 | $1,254 | $33,760 | $9,200 | $24,560 |
| 2016 | $1,368 | $37,320 | $9,200 | $28,120 |
| 2015 | $954 | $24,400 | $6,000 | $18,400 |
| 2014 | $957 | $24,400 | $6,000 | $18,400 |
Source: Public Records
Map
Nearby Homes
- 5181 Cold Springs Dr NW
- 5345 Seattle Slew Ct Unit 3
- 5271 Williams Rd Unit A-1
- 5333 Bishops Cir
- 1066 Worcester Place NW Unit 4
- 5323 Sherwin Dr
- 5148 Whited Way NW Unit 1
- 5331 Sherwin Dr
- 5343 Sherwin Dr Unit 15
- 1133 Sandune Dr
- 5431 Village Green Square Unit 1018
- 5425 Village Green Square Unit 3
- 5016 Comanche Ct NW
- 0 Harbins Rd NW Unit 7598091
- 1013 Sandune Dr
- 5554 Clover Rise Ln Unit 2
- 1049 Knights Bridge Ct
- 1037 Dover Way
- 1066 Rock Creek Ln
- 1413 Silver Lake Dr
- 1127 Riva Ridge Dr Unit 2
- 5215 Secretariat Ct Unit 2
- 1111 Riva Ridge Dr
- 1133 Riva Ridge Dr NW
- 5218 Derby Way
- 1133 Riva Ridge Dr
- 1122 Riva Ridge Dr Unit 2
- 1122 Riva Ridge Dr NW
- 5209 Secretariat Ct
- 1116 Riva Ridge Dr
- 1128 Riva Ridge Dr
- 5214 Secretariat Ct Unit 2
- 1105 Riva Ridge Dr Unit 2
- 1110 Riva Ridge Dr Unit 2
- 5212 Derby Way
- 1134 Riva Ridge Dr Unit 2
- 5207 Secretariat Ct Unit 2
- 5208 Secretariat Ct
- 5201 Secretariat Ct Unit 2
- 1104 Riva Ridge Dr Unit 2