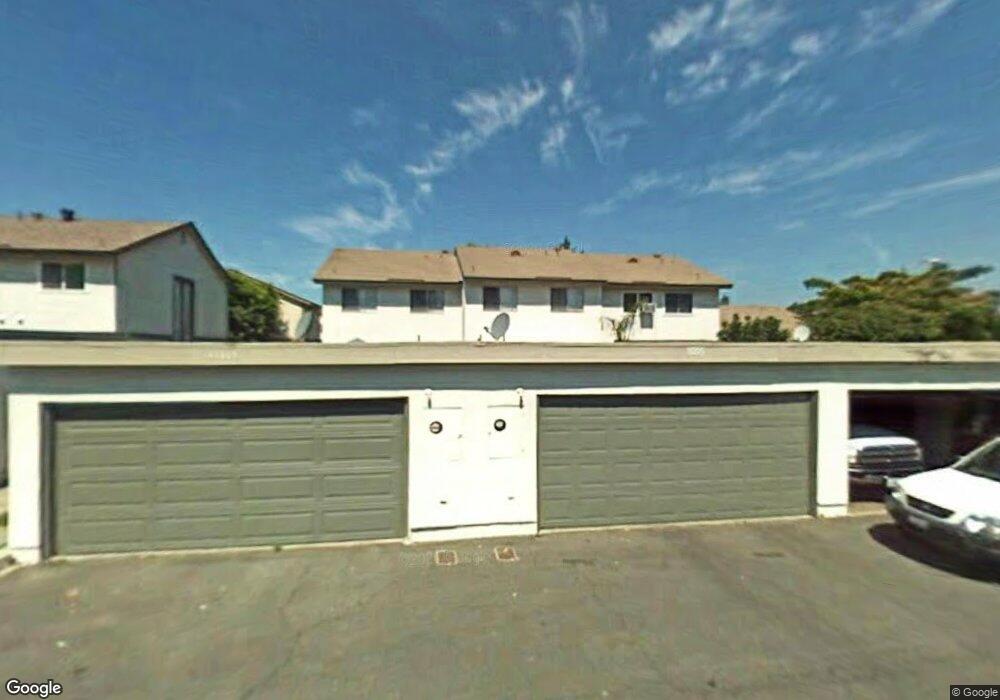
11215 Hood Way Stanton, CA 90680
Estimated Value: $601,000 - $808,000
3
Beds
2
Baths
1,159
Sq Ft
$591/Sq Ft
Est. Value
About This Home
This home is located at 11215 Hood Way, Stanton, CA 90680 and is currently estimated at $684,588, approximately $590 per square foot. 11215 Hood Way is a home located in Orange County with nearby schools including Bryant Elementary School, Hilton D. Bell Intermediate School, and Pacifica High School.
Ownership History
Date
Name
Owned For
Owner Type
Purchase Details
Closed on
Dec 23, 2015
Sold by
Dang Thuy Bich Thi and Nguyen Tang Hung
Bought by
Huynh Thanh Phuong Ngoc
Current Estimated Value
Home Financials for this Owner
Home Financials are based on the most recent Mortgage that was taken out on this home.
Original Mortgage
$242,000
Outstanding Balance
$191,826
Interest Rate
3.94%
Mortgage Type
New Conventional
Estimated Equity
$492,762
Purchase Details
Closed on
Jul 22, 2011
Sold by
Phan Hien Quang
Bought by
Dang Thuy Bich Thi and Nguyen Tang Hung
Purchase Details
Closed on
Mar 6, 2007
Sold by
Buday Joann B
Bought by
Phan Hien Quang
Home Financials for this Owner
Home Financials are based on the most recent Mortgage that was taken out on this home.
Original Mortgage
$314,400
Interest Rate
5.87%
Mortgage Type
Purchase Money Mortgage
Purchase Details
Closed on
Sep 2, 2003
Sold by
Alvarez Stephen C and Alverez Belinda S
Bought by
Buday Joann B
Home Financials for this Owner
Home Financials are based on the most recent Mortgage that was taken out on this home.
Original Mortgage
$255,983
Interest Rate
6.17%
Mortgage Type
FHA
Purchase Details
Closed on
Aug 31, 2001
Sold by
Sullivan Patrick J
Bought by
Alvarez Stephen C and Alvarez Belinda S
Home Financials for this Owner
Home Financials are based on the most recent Mortgage that was taken out on this home.
Original Mortgage
$174,265
Interest Rate
6.91%
Mortgage Type
FHA
Purchase Details
Closed on
Aug 17, 1998
Sold by
Sullivan Kathryn Jo
Bought by
Sullivan Patrick J
Home Financials for this Owner
Home Financials are based on the most recent Mortgage that was taken out on this home.
Original Mortgage
$119,223
Interest Rate
6.91%
Mortgage Type
FHA
Purchase Details
Closed on
Jul 7, 1998
Sold by
Kathy Kaltenbach
Bought by
Sullivan Patrick J
Home Financials for this Owner
Home Financials are based on the most recent Mortgage that was taken out on this home.
Original Mortgage
$119,223
Interest Rate
6.91%
Mortgage Type
FHA
Purchase Details
Closed on
Dec 22, 1994
Sold by
Kaltenbach John
Bought by
Kaltenbach Kathy
Home Financials for this Owner
Home Financials are based on the most recent Mortgage that was taken out on this home.
Original Mortgage
$75,000
Interest Rate
8.12%
Create a Home Valuation Report for This Property
The Home Valuation Report is an in-depth analysis detailing your home's value as well as a comparison with similar homes in the area
Home Values in the Area
Average Home Value in this Area
Purchase History
| Date | Buyer | Sale Price | Title Company |
|---|---|---|---|
| Huynh Thanh Phuong Ngoc | $346,500 | Provident Title Company | |
| Dang Thuy Bich Thi | $228,000 | Orange Coast Title Company | |
| Phan Hien Quang | $393,000 | Multiple | |
| Buday Joann B | $260,000 | First American Title Company | |
| Alvarez Stephen C | $177,000 | Gateway Title Company | |
| Sullivan Patrick J | -- | Stewart Title | |
| Sullivan Patrick J | $120,000 | Stewart Title | |
| Kaltenbach Kathy | -- | Benefit Land Title Co | |
| Fulton Doris M | -- | Benefit Land Title Co |
Source: Public Records
Mortgage History
| Date | Status | Borrower | Loan Amount |
|---|---|---|---|
| Open | Huynh Thanh Phuong Ngoc | $242,000 | |
| Previous Owner | Phan Hien Quang | $314,400 | |
| Previous Owner | Buday Joann B | $255,983 | |
| Previous Owner | Alvarez Stephen C | $174,265 | |
| Previous Owner | Sullivan Patrick J | $119,223 | |
| Previous Owner | Fulton Doris M | $75,000 |
Source: Public Records
Tax History Compared to Growth
Tax History
| Year | Tax Paid | Tax Assessment Tax Assessment Total Assessment is a certain percentage of the fair market value that is determined by local assessors to be the total taxable value of land and additions on the property. | Land | Improvement |
|---|---|---|---|---|
| 2025 | $4,790 | $409,738 | $333,769 | $75,969 |
| 2024 | $4,790 | $401,704 | $327,224 | $74,480 |
| 2023 | $4,699 | $393,828 | $320,808 | $73,020 |
| 2022 | $4,630 | $386,106 | $314,517 | $71,589 |
| 2021 | $4,586 | $378,536 | $308,350 | $70,186 |
| 2020 | $4,531 | $374,655 | $305,188 | $69,467 |
| 2019 | $4,418 | $367,309 | $299,204 | $68,105 |
| 2018 | $4,345 | $360,107 | $293,337 | $66,770 |
| 2017 | $4,284 | $353,047 | $287,586 | $65,461 |
| 2016 | $4,177 | $346,125 | $281,947 | $64,178 |
| 2015 | $3,017 | $238,282 | $175,552 | $62,730 |
| 2014 | $2,918 | $233,615 | $172,113 | $61,502 |
Source: Public Records
Map
Nearby Homes
- 11231 Windemere Way
- 7271 Katella Ave Unit 9
- 7271 Katella Ave
- 7271 Katella Ave Unit 84
- 7271 Katella Ave Unit 10
- 7224 Kermore Ln
- 7455 Bock Ave
- 6837 Amelia Way
- 10786 Mitchell Dr
- 39 Bigsby Dr
- 10700 Knott Ave
- 11390 Nantucket Ct
- 6897 Leilani Ln
- 10711 Pamela St
- 10632 Tammy St
- 10531 Western Ave
- 6861 Reefton Ave
- 7911 Orangewood Ave
- 11474 Shippigan Way
- 10550 Western Ave Unit 43
- 11213 Hood Way
- 11211 Hood Way
- 11217 Hood Way
- 11219 Hood Way
- 11221 Hood Way
- 11216 Hood Way
- 11218 Hood Way
- 11214 Hood Way
- 11220 Hood Way
- 7357 Kirby Way
- 11225 Hood Way
- 7345 Kirby Way
- 11224 Hood Way
- 11071 Kibbins Cir
- 11226 Hood Way
- 11073 Kibbins Cir
- 7341 Kirby Way
- 11075 Kibbins Cir
- 11228 Hood Way
- 11077 Kibbins Cir