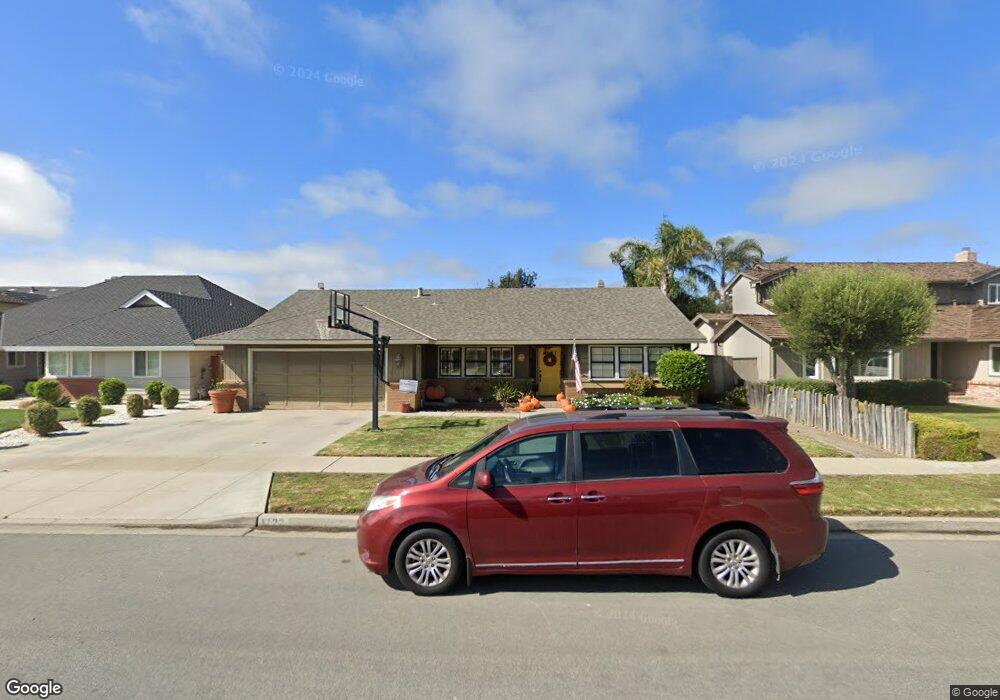
1122 Orinda Way Unit 2 Salinas, CA 93901
South Salinas NeighborhoodEstimated Value: $905,139 - $1,009,000
3
Beds
2
Baths
2,028
Sq Ft
$470/Sq Ft
Est. Value
About This Home
This home is located at 1122 Orinda Way Unit 2, Salinas, CA 93901 and is currently estimated at $953,535, approximately $470 per square foot. 1122 Orinda Way Unit 2 is a home located in Monterey County with nearby schools including University Park Elementary School, Mission Park Elementary School, and Lincoln Elementary School.
Ownership History
Date
Name
Owned For
Owner Type
Purchase Details
Closed on
Jul 11, 2000
Sold by
Maker Stephanie R
Bought by
Maker Wyatt P
Current Estimated Value
Home Financials for this Owner
Home Financials are based on the most recent Mortgage that was taken out on this home.
Original Mortgage
$314,400
Outstanding Balance
$110,668
Interest Rate
8%
Estimated Equity
$842,867
Purchase Details
Closed on
May 18, 1999
Sold by
Sites Daniel K and Sites Jennifer L
Bought by
Sites Daniel K and Sites Jennifer L
Purchase Details
Closed on
Mar 5, 1998
Sold by
Sites Jennifer L
Bought by
Sites Dennis K and Sites Jennifer L
Home Financials for this Owner
Home Financials are based on the most recent Mortgage that was taken out on this home.
Original Mortgage
$135,000
Interest Rate
7.11%
Purchase Details
Closed on
Sep 11, 1996
Sold by
Pattee Ranch Associates
Bought by
Sites Dennis J and Sites Millicent J
Purchase Details
Closed on
Feb 1, 1996
Sold by
Adams Rick T and Adams Amy B
Bought by
Sites Dennis J and Sites Millicent J
Create a Home Valuation Report for This Property
The Home Valuation Report is an in-depth analysis detailing your home's value as well as a comparison with similar homes in the area
Home Values in the Area
Average Home Value in this Area
Purchase History
We collect this data history from publicly available records. To have your information removed, we recommend requesting removal directly through your county’s website.
| Date | Buyer | Sale Price | Title Company |
|---|---|---|---|
| Maker Wyatt P | -- | Old Republic Title Company | |
| Maker Wyatt P | $393,000 | Old Republic Title Company | |
| Sites Daniel K | -- | -- | |
| Sites Dennis K | -- | -- | |
| Sites Jennifer L | -- | Old Republic Title Company | |
| Sites Jennifer L | $260,000 | Old Republic Title Company | |
| Sites Dennis J | $257,000 | Chicago Title | |
| Sites Dennis J | $124,000 | First American Title Co |
Source: Public Records
Mortgage History
We collect this data history from publicly available records. To have your information removed, we recommend requesting removal directly through your county’s website.
| Date | Status | Borrower | Loan Amount |
|---|---|---|---|
| Open | Maker Wyatt P | $314,400 | |
| Previous Owner | Sites Jennifer L | $135,000 |
Source: Public Records
Tax History
| Year | Tax Paid | Tax Assessment Tax Assessment Total Assessment is a certain percentage of the fair market value that is determined by local assessors to be the total taxable value of land and additions on the property. | Land | Improvement |
|---|---|---|---|---|
| 2025 | $7,461 | $592,195 | $158,215 | $433,980 |
| 2024 | $7,461 | $580,584 | $155,113 | $425,471 |
| 2023 | $7,133 | $569,201 | $152,072 | $417,129 |
| 2022 | $6,770 | $558,041 | $149,091 | $408,950 |
| 2021 | $6,428 | $547,100 | $146,168 | $400,932 |
| 2020 | $6,268 | $541,491 | $144,670 | $396,821 |
| 2019 | $6,189 | $530,875 | $141,834 | $389,041 |
| 2018 | $6,082 | $520,466 | $139,053 | $381,413 |
| 2017 | $6,051 | $510,262 | $136,327 | $373,935 |
| 2016 | $5,890 | $500,257 | $133,654 | $366,603 |
| 2015 | $5,497 | $471,000 | $126,000 | $345,000 |
| 2014 | $4,299 | $388,000 | $104,000 | $284,000 |
Source: Public Records
Map
Nearby Homes
- 709 San Leandro Cir
- 739 Bellarmine Dr
- 782 Fairfax Dr
- 767 Lemos Ave
- 783 Central Ave
- 516 College Dr
- 311 Amherst Dr
- 1253 Los Olivos Dr Unit 5
- 325 San Vincente Ave
- 612 Central Ave
- 606 Central Ave
- 1310 Primavera St Unit 109
- 640 Park St
- 89 Clark St
- 1051 Riker St Unit 7
- 906 Bautista Dr
- 138 Nissen Rd Unit 1
- 333 West St
- 746 Nacional Ct
- 1052 Padre Dr Unit 3
- 1118 Orinda Way
- 1126 Orinda Way
- 1117 Palo Alto Way
- 1113 Palo Alto Way
- 1114 Orinda Way
- 1128 Orinda Way
- 1109 Palo Alto Way
- 1125 Orinda Way
- 1121 Orinda Way
- 1129 Orinda Way
- 1125 Palo Alto Way
- 1117 Orinda Way
- 1110 Orinda Way
- 1195 Loyola Dr
- 1105 Palo Alto Way
- 1131 Orinda Way
- 1113 Orinda Way
- 1129 Palo Alto Way
- 1114 Palo Alto Way
- 1136 Kentfield Dr
Your Personal Tour Guide
Ask me questions while you tour the home.