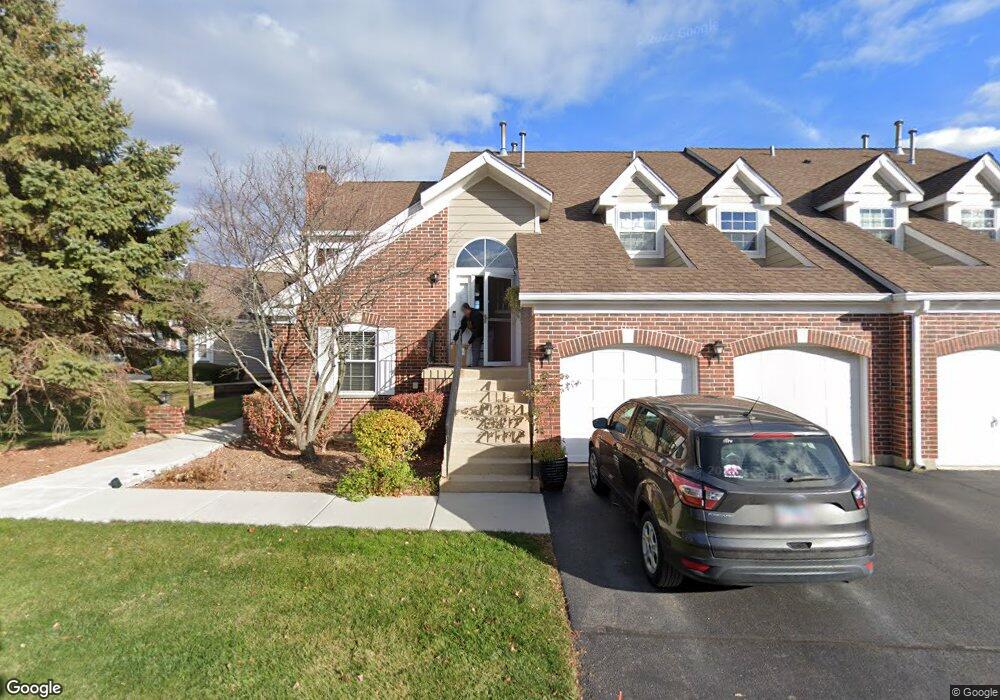
1122 Saint Andrews Ct Unit 212 Algonquin, IL 60102
Estimated Value: $285,000 - $290,000
2
Beds
2
Baths
1,473
Sq Ft
$196/Sq Ft
Est. Value
About This Home
This home is located at 1122 Saint Andrews Ct Unit 212, Algonquin, IL 60102 and is currently estimated at $288,333, approximately $195 per square foot. 1122 Saint Andrews Ct Unit 212 is a home located in McHenry County with nearby schools including Westfield Community School, Kenneth E Neubert Elementary School, and Harry D Jacobs High School.
Ownership History
Date
Name
Owned For
Owner Type
Purchase Details
Closed on
Jul 10, 2015
Sold by
Stromberg Janet L
Bought by
North Shore Holdings Ltd
Current Estimated Value
Purchase Details
Closed on
Apr 18, 2007
Sold by
Frailing Donald J
Bought by
Stromberg Janet L
Home Financials for this Owner
Home Financials are based on the most recent Mortgage that was taken out on this home.
Original Mortgage
$185,000
Interest Rate
6.21%
Mortgage Type
Unknown
Purchase Details
Closed on
Jul 25, 2002
Sold by
Frailing Donald J
Bought by
Frailing Donald J and Betterly Joan J
Purchase Details
Closed on
Apr 12, 2002
Sold by
Forti Robert and Forti Marilyn
Bought by
Frailing Clarence C and Frailing Donald J
Create a Home Valuation Report for This Property
The Home Valuation Report is an in-depth analysis detailing your home's value as well as a comparison with similar homes in the area
Home Values in the Area
Average Home Value in this Area
Purchase History
| Date | Buyer | Sale Price | Title Company |
|---|---|---|---|
| North Shore Holdings Ltd | $87,000 | Attorney | |
| Stromberg Janet L | $199,500 | Republic Title Company | |
| Frailing Donald J | -- | -- | |
| Frailing Clarence C | $155,000 | -- |
Source: Public Records
Mortgage History
| Date | Status | Borrower | Loan Amount |
|---|---|---|---|
| Previous Owner | Stromberg Janet L | $185,000 |
Source: Public Records
Tax History Compared to Growth
Tax History
| Year | Tax Paid | Tax Assessment Tax Assessment Total Assessment is a certain percentage of the fair market value that is determined by local assessors to be the total taxable value of land and additions on the property. | Land | Improvement |
|---|---|---|---|---|
| 2024 | $5,754 | $73,549 | $15,898 | $57,651 |
| 2023 | $5,507 | $65,781 | $14,219 | $51,562 |
| 2022 | $5,232 | $61,003 | $22,849 | $38,154 |
| 2021 | $5,043 | $56,832 | $21,287 | $35,545 |
| 2020 | $4,922 | $54,820 | $20,533 | $34,287 |
| 2019 | $4,818 | $52,470 | $19,653 | $32,817 |
| 2018 | $4,639 | $48,665 | $18,155 | $30,510 |
| 2017 | $4,565 | $45,845 | $17,103 | $28,742 |
| 2016 | $4,522 | $42,998 | $16,041 | $26,957 |
| 2013 | -- | $45,252 | $14,965 | $30,287 |
Source: Public Records
Map
Nearby Homes
- 1405 Surrey Ln
- 1 N Hubbard St
- SWC Talaga and Algonquin Rd
- 1820 Crofton Dr
- 741 Regal Ln
- 2043 Peach Tree Ln Unit 4122
- 700 Fairfield Ln
- 1801 Arbordale Ln
- 000 County Line Rd
- 1900 Waverly Ln
- 2233 Dawson Ln Unit 312
- 30 Arbordale Ct Unit 4284
- 710 Braewood Dr
- 1235 Fairmont Ct
- 710 Sprucetree Ln
- 615 Harper Dr
- Adams Plan at Algonquin Meadows - Single Family
- Sequoia Plan at Algonquin Meadows - Single Family
- Bryce Plan at Algonquin Meadows - Single Family
- Rainier Plan at Algonquin Meadows - Single Family
- 1122 St Andrews Ct Unit 1122
- 1122 Saint Andrews Ct Unit 1122
- 1124 Saint Andrews Ct Unit 215
- 1124 Saint Andrews Ct Unit 1
- 1108 Saint Andrews Ct Unit 201
- 1126 Saint Andrews Ct Unit 211
- 1128 Saint Andrews Ct
- 1106 Saint Andrews Ct Unit 202
- 1148 Saint Andrews Ct Unit 221
- 1104 Saint Andrews Ct Unit 203
- 1102 Saint Andrews Ct Unit 204
- 1146 Saint Andrews Ct Unit 222
- 1104 St Andrews Ct
- 1142 Saint Andrews Ct Unit 223
- 1144 Saint Andrews Ct Unit 224
- 1137 Saint Andrews Ct
- 1113 Saint Andrews Ct Unit 283
- 1111 Saint Andrews Ct Unit 282
- 1117 Saint Andrews Ct Unit 284