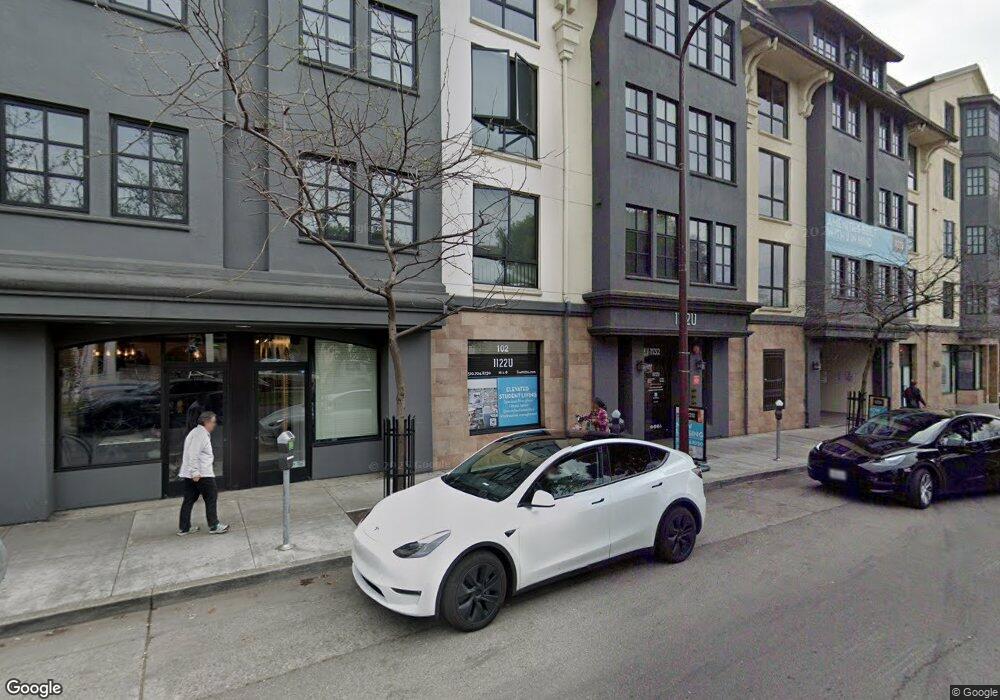
1122 University Ave Berkeley, CA 94702
West Berkeley Neighborhood
3
Beds
--
Bath
1,076
Sq Ft
--
Built
About This Home
Now Leasing for Fall 2025! Discover a new side to West Berkeley from the comfort and convenience of a modern apartment community! Enjoy our shuttle service to the BART station and UC Berkeley. Gather with friends and enjoy the sunset from our rooftop deck, with unparalleled bay area views, or collaborate in the Sky Lounge with free WiFi access. At 1122U, we gladly welcome your pets and encourage you to take them on walks or catch a cool breeze within our landscaped Courtyard. Schedule a tour today! In-person, self-guided, and virtual tours available. Call us today for more information! Greystar California, Inc., Broker License #01525765
Create a Home Valuation Report for This Property
The Home Valuation Report is an in-depth analysis detailing your home's value as well as a comparison with similar homes in the area
Home Values in the Area
Average Home Value in this Area
Property History
| Date | Event | Price | List to Sale | Price per Sq Ft |
|---|---|---|---|---|
| 11/04/2025 11/04/25 | Off Market | $3,795 | -- | -- |
| 10/30/2025 10/30/25 | Price Changed | $3,795 | +36.4% | $9 / Sq Ft |
| 10/04/2025 10/04/25 | Price Changed | $2,782 | -3.9% | $7 / Sq Ft |
| 10/01/2025 10/01/25 | Price Changed | $2,895 | -25.7% | $7 / Sq Ft |
| 09/28/2025 09/28/25 | Price Changed | $3,895 | +40.0% | $9 / Sq Ft |
| 09/20/2025 09/20/25 | Price Changed | $2,782 | -3.9% | $7 / Sq Ft |
| 09/16/2025 09/16/25 | Price Changed | $2,895 | -0.5% | $7 / Sq Ft |
| 09/14/2025 09/14/25 | Price Changed | $2,910 | +4.6% | $7 / Sq Ft |
| 09/14/2025 09/14/25 | Price Changed | $2,782 | -4.4% | $7 / Sq Ft |
| 09/09/2025 09/09/25 | Price Changed | $2,910 | -27.2% | $7 / Sq Ft |
| 09/08/2025 09/08/25 | Price Changed | $3,995 | +74.1% | $9 / Sq Ft |
| 09/03/2025 09/03/25 | Price Changed | $2,295 | -1.2% | $5 / Sq Ft |
| 08/21/2025 08/21/25 | Price Changed | $2,324 | -10.5% | $5 / Sq Ft |
| 03/20/2025 03/20/25 | Price Changed | $2,597 | 0.0% | $6 / Sq Ft |
| 12/03/2024 12/03/24 | Price Changed | $2,597 | -45.9% | $6 / Sq Ft |
| 11/09/2024 11/09/24 | Price Changed | $4,799 | -29.4% | $11 / Sq Ft |
| 11/02/2024 11/02/24 | Price Changed | $6,799 | +41.7% | $16 / Sq Ft |
| 10/24/2024 10/24/24 | Price Changed | $4,799 | +54.5% | $11 / Sq Ft |
| 10/09/2024 10/09/24 | Price Changed | $3,107 | +19.6% | $7 / Sq Ft |
| 09/13/2024 09/13/24 | Price Changed | $2,597 | +5.1% | $6 / Sq Ft |
| 08/21/2024 08/21/24 | Price Changed | $2,472 | -4.8% | $6 / Sq Ft |
| 07/24/2024 07/24/24 | Price Changed | $2,597 | +3.6% | $6 / Sq Ft |
| 06/13/2024 06/13/24 | Price Changed | $2,507 | +21.9% | $6 / Sq Ft |
| 05/21/2024 05/21/24 | Price Changed | $2,056 | -18.0% | $5 / Sq Ft |
| 05/15/2024 05/15/24 | Price Changed | $2,507 | +4.5% | $6 / Sq Ft |
| 05/15/2024 05/15/24 | Price Changed | $2,400 | +16.7% | $6 / Sq Ft |
| 04/19/2024 04/19/24 | Price Changed | $2,056 | -14.3% | $5 / Sq Ft |
| 04/19/2024 04/19/24 | Price Changed | $2,400 | -11.1% | $6 / Sq Ft |
| 06/21/2023 06/21/23 | For Rent | -- | -- | -- |
| 05/06/2023 05/06/23 | Price Changed | $2,700 | 0.0% | $6 / Sq Ft |
| 04/29/2023 04/29/23 | Price Changed | $2,700 | -28.9% | $6 / Sq Ft |
| 06/07/2022 06/07/22 | For Rent | -- | -- | -- |
| 05/18/2022 05/18/22 | For Rent | $3,795 | -- | -- |
Tax History
| Year | Tax Paid | Tax Assessment Tax Assessment Total Assessment is a certain percentage of the fair market value that is determined by local assessors to be the total taxable value of land and additions on the property. | Land | Improvement |
|---|---|---|---|---|
| 2025 | $654,035 | $44,613,505 | $7,798,963 | $36,493,809 |
| 2024 | $654,035 | $43,814,699 | $7,646,083 | $35,778,435 |
| 2023 | $641,653 | $42,573,057 | $7,496,160 | $35,076,897 |
| 2022 | $630,448 | $42,143,810 | $7,349,193 | $34,389,195 |
| 2021 | $632,328 | $41,359,470 | $7,205,116 | $34,154,354 |
| 2020 | $599,767 | $40,966,429 | $7,131,264 | $33,835,165 |
| 2019 | $576,684 | $40,114,669 | $6,991,488 | $33,123,181 |
| 2018 | $565,277 | $39,163,125 | $6,854,400 | $32,308,725 |
| 2017 | $435,260 | $29,196,606 | $7,248,850 | $21,947,756 |
| 2016 | $422,268 | $28,626,515 | $7,106,750 | $21,519,765 |
| 2015 | $416,481 | $28,186,430 | $7,000,000 | $21,186,430 |
| 2014 | $328,066 | $20,857,050 | $5,252,400 | $15,604,650 |
Source: Public Records
Map
Nearby Homes
- 1919 Curtis St
- 1128 Delaware St
- 1728 Curtis St
- 1050 Allston Way
- 998 Virginia St
- 1322 Virginia St
- 2220 7th St
- 1623 10th St
- 935 Virginia St
- 1039 Channing Way
- 1609 Kains Ave
- 2238 7th St
- 1411 Hearst Ave Unit 2
- 817 Delaware St
- 917 Channing Way
- 2423 10th St
- 2304 Edwards St
- 1504 10th St
- 2413 7th St
- 1813 Sacramento St
- 1122 University Ave
- 1110 University Ave
- 1121 Addison St
- 2009 San Pablo Ave
- 1127 Addison St
- 1131 Addison St
- 2033 San Pablo Ave
- 1176 University Ave
- 1135 Addison St
- 1105 University Ave
- 2057 San Pablo Ave
- 1141 Addison St
- 1120 Addison St
- 1143 Addison St
- 1114 Addison St
- 1187 University Ave
- 2101 San Pablo Ave
- 1124 Addison St
- 1112 Addison St
- 1110 Addison St